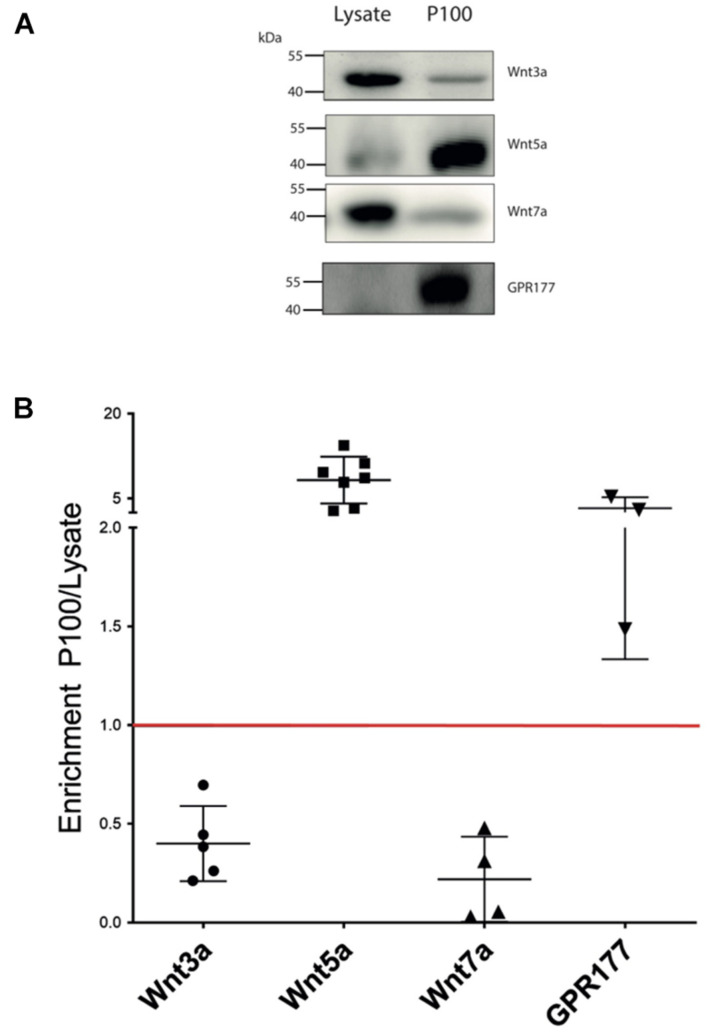
FIGURE 2.
Wnt ligand expression levels in HT-22 cells. (A) Comparison of western blot analysis of Wnt3a, Wnt5a, Wnt7a, and GPR177 protein content in cell lysate and P100 fraction. Each lane was loaded with 30 μg protein. (B) Summary densitometric measurement of band intensity showing enrichment (fold) of each protein in the P100 pellet relative to a corresponding lysate. Wnt3a, 0.4 ± 0.19 (n = 5); Wnt5a, 8.70 ± 4.14 (n = 7); Wnt7a, 0.22 ± 0.21 (n = 4; four independent cell culture preparations); GPR177 3.30 ± 1.93 (n = 3; independent cell culture preparations).

