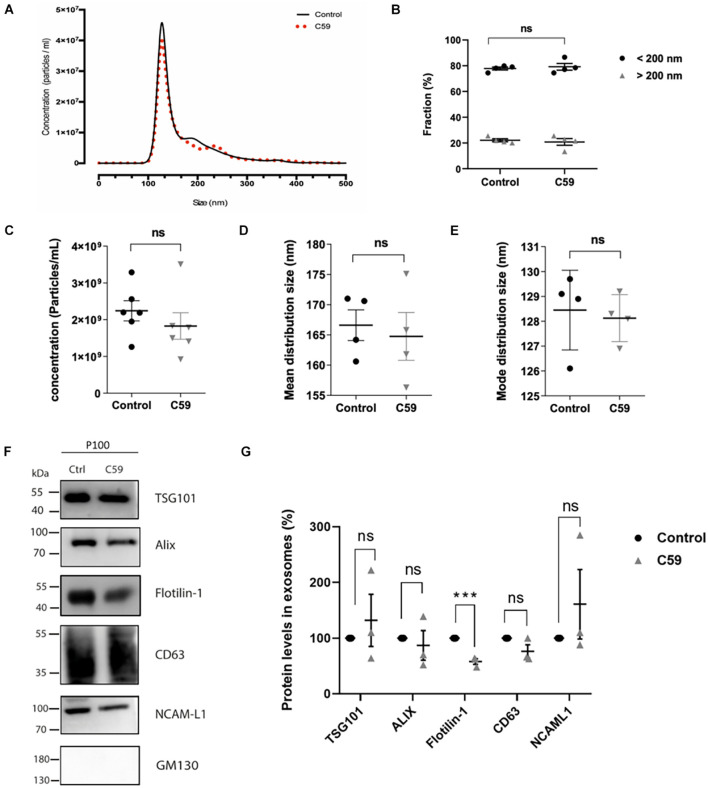
FIGURE 4.
Nanoparticle tracking analyses of exosomes secreted by control and Wnt-C59 treated HT-22 cells and the effect of Wnt-C59 on the content of exosomal markers in the P100 fraction. (A) Representative Nanoparticle tracking analyses show a mean peak for both control and Wnt-C59 samples. (B) Abundance analysis shows that 80% of the vesicles have a diameter of <200 nm (Control: 77.88 ± 2.41%, Wnt-C59: 79.20 ± 5.22; n = 4) and a 20% >200 nm (Control: 22.12 ± 2.41%, Wnt-C59: 20.83 ± 5.22; n = 4). (C) Concentration of particles. Shapiro–Wilk and KS tests showed that the data conformed to a normal distribution. Subsequently, the result of the Student unpaired t-test was p = 0.8272 with values of 2.3 × 10⁹ ± 7.6 × 10⁸ (control; n = 7) and 1.9 × 10⁹ ± 8.3 × 10⁸ (Wnt-C59; n = 7). (D) Mean distribution size of the total extracellular vesicles. Shapiro–Wilk and KS tests showed that the data conformed to a normal distribution. Subsequently, the result of the Student unpaired t-test was p = 0.7602 with values of 166.6 ± 2.5 (control; n = 7) and 164.8 ± 3.9 nm (Wnt-C59; n = 7). (E) Mode distribution size. As in (D), values conform with a normal distribution. The student unpaired t-test result was p = 0.7824 with values of 128.5 ± 0.8 nm (control; n = 7) and 128.1 ± 0.4 nm (Wnt-C59; n = 7). n value means the number of independent cell culture preparations. (F) Representative western blot analysis of the protein content of TSG101, Alix, Flotillin-1, CD63, NCAM-L1 in P100 from control and C59 treated HT-22 cells. GM130 purity control is absent in the P100 fraction. (G) Relative protein expression levels of exosomal markers. The staining intensity of each band derived from control P100 was assigned a value of 100%, and the value obtained in the P100 from Wnt-C59 treatment was compared with its respective control. Flotillin-1 was the only exosomal marker whose expression level underwent a significant decrease in exosomes secreted by WntC59 treated HT-22 cells. TSG101 (Control: 100%, Wnt-C59: 132 ± 81.3%; n = 3; p = 0.700); Alix (Control: 100%, Wnt-C59: 87 ± 45.9%; n = 3; p = 0.6496); Flotillin-1 (Control: 100%, Wnt-C59: 58 ± 8.7%; n = 3; p = 0.0011); CD63 (100%, Wnt-C59: 76.3 ± 20.6; n = 3; p = 0.0952); NCAM-L1 (Control: 100%, Wnt-C59: 161 ± 157.9; n = 3; p = 0.3831). Mann–Whitney non-parametric t-student test (ns, not significant; ***p < 0.005).

