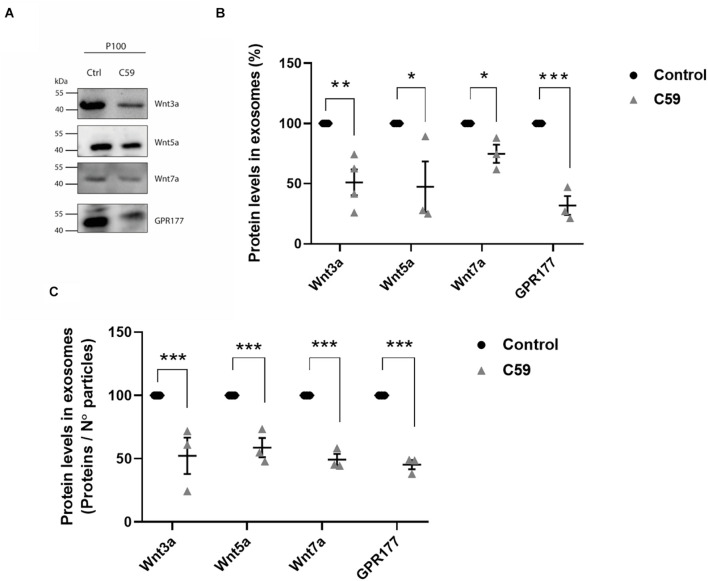
FIGURE 5.
Effects of Wnt-C59 on the content of Wnt ligands in the P100 fraction. (A) Comparison of the western blot analysis of Wnt3a, Wnt5a, Wnt7a, and GPR177 protein expression levels in the P100 fraction derived from control and Wnt-C59 treated cells (each lane was loaded with 30 μg protein). (B) Relative protein expression levels of Wnt ligands and GPR177 in the P100 fraction. The staining intensity of each band derived from control P100 was assigned a value of 100%, and the value obtained in the P100 from Wnt-C59 treatment was compared with its respective control. Wnt3a (Control: 100%, Wnt-C59: 51.1 ± 21.5%; n = 3; p = 0.0039); Wnt5a (Control: 100%, Wnt-C59: 39.1 ± 45.6%; n = 3; p = 0.0404); Wnt7a (Control: 100%, Wnt-C59: 74.82 ± 13.1%; n = 3; p = 0.0291); GPR177 (Control: 100%, Wnt-C59: 31.9 ± 13.6%; n = 3; p = 0.001). (C) Protein expression levels of Wnt ligands and GPR177 relative to the number of particles loaded per well. Control P100 was assigned a value of 100%, and the value obtained in the P100 from Wnt-C59 treatment was compared with its respective control. In both types of analysis of (B,C), the Wnt3a, Wnt5a, Wnt7a, and GPR177 contents significantly decreased in the exosomes secreted by Wnt-C59 treated cells relative to their levels in the control cells based on the results of Mann–Whitney non-parametric t-student test (ns, not significant; *p < 0.05; **p < 0.01; ***p < 0.005). Wnt3a (Control: 100%, Wnt-C59: 52.4 ± 24.9%; n = 3; p = 0.0295); Wnt5a (Control: 100%, Wnt-C59: 58.8 ± 13.2%; n = 3; p = 0.0056); Wnt7a (Control: 100%, Wnt-C59: 49.4 ± 7.8%; n = 3; p = 0.0004); GPR177 (Control: 100%, Wnt-C59: 45.3 ± 6.2%; n = 3; p = 0.0001). n value means the number independent cell culture preparations.

