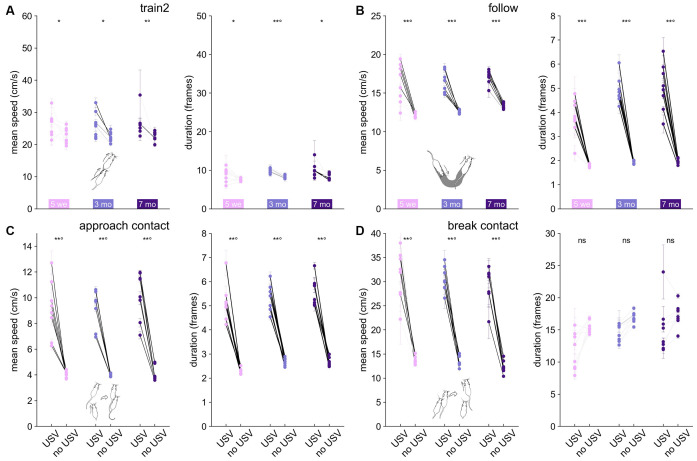
Figure 6.
Variations in mean speed and duration of each behavioral event according to the presence or absence of USVs in B6 females. Variations of the mean speed of the animal performing the behavior (left panel) and of the event duration (right panel) for (A) Train2, (B) follow, (C) approach contact, and (D) break contact. Paired comparisons between behaviors with and without USVs were conducted at the group level using the paired Wilcoxon test for each age class (*p < 0.05, **p < 0.01; p-values remaining significant after correction for multiple testing over age classes were followed by °). Significant differences at the individual level using Mann–Whitney U-tests after Bonferroni correction are depicted by the color of the segments linking the mean value, with and without USVs. light gray: not significant, medium gray: p < 0.05, dark gray: p < 0.01, black: p < 0.001.

