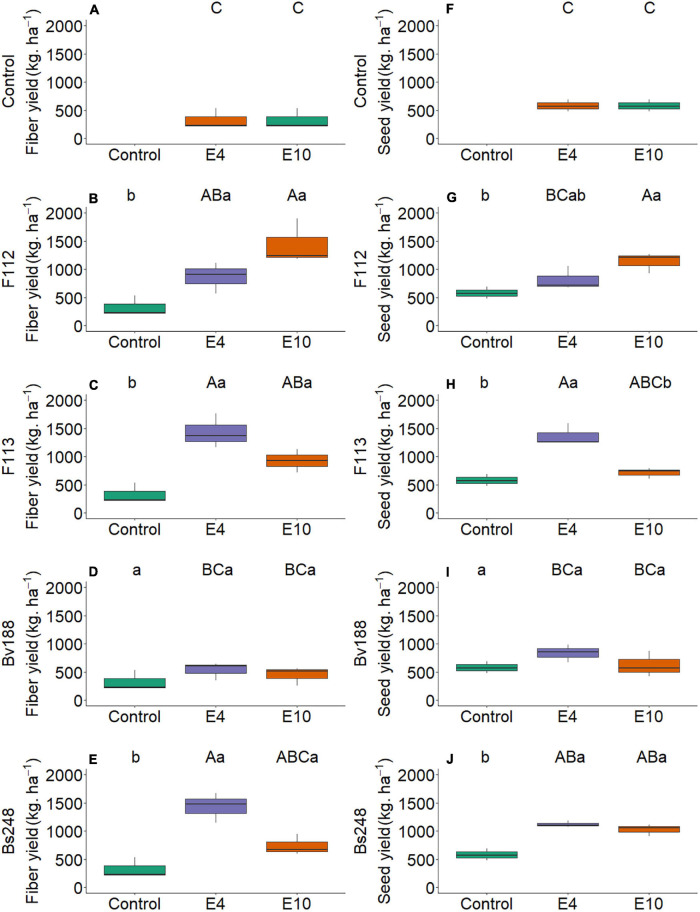
FIGURE 11.
Boxplots (median and quartiles) of fiber (A–E) and seed (F–J) cotton yield inoculated with plant growth-promoting microorganisms in two concentrations. Different lowercase letters in a row and uppercase letters in a column indicate statistical difference between means (Tukey, p < 0.05). F112, Aspergillus sydowii; F113, Aspergillus sp.; Bv188, Bacillus velezensis strain Bv188; Bs248, Bacillus subtilis strain Bs248; E4, 1 × 10⁴; E10, 1 × 10¹⁰ conidia or CFU mL−1; Ctrl, control; and CFU, colony-forming units.

