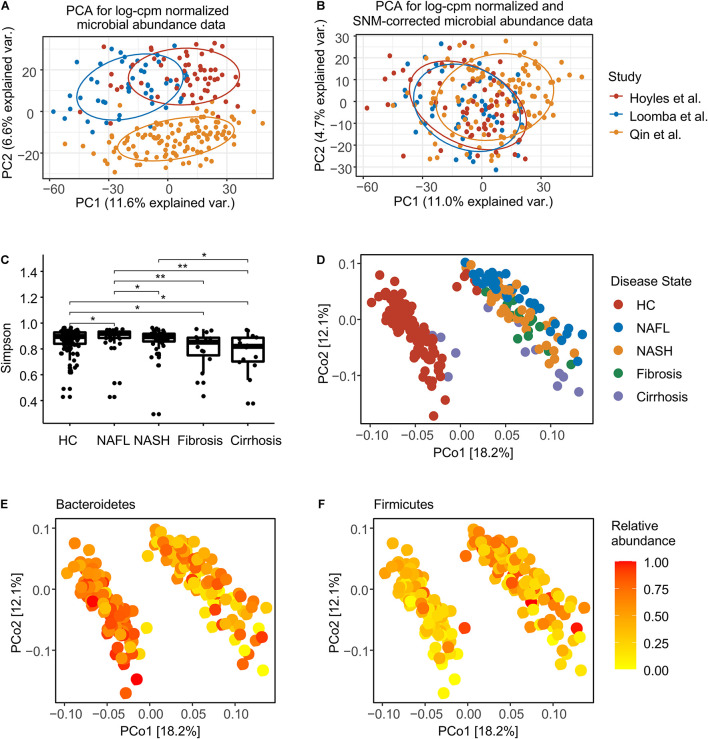
FIGURE 1.
Normalization and overview of the NAFLD microbiome taxonomic profiles at species level. (A) Principal components analysis (PCA) of log-cpm normalized data, with NAFLD microbiome samples colored by studies. (B) PCA of log-cpm-SNM data. (C) Alpha diversity for each disease stage. The differences were calculated by two-sided Wilcoxon test. *p < 0.05; **p < 0.01. (D) Principal coordinates analysis (PCoA) based on species-level Bray–Curtis dissimilarity colored by disease stage. (E) PCoA colored by the normalized abundance of phylum Bacteroidetes. (F) PCoA colored by the normalized abundance of phylum Firmicutes. HC, healthy controls; NAFL, non-alcoholic fatty liver; NASH, non-alcoholic steatohepatitis.

