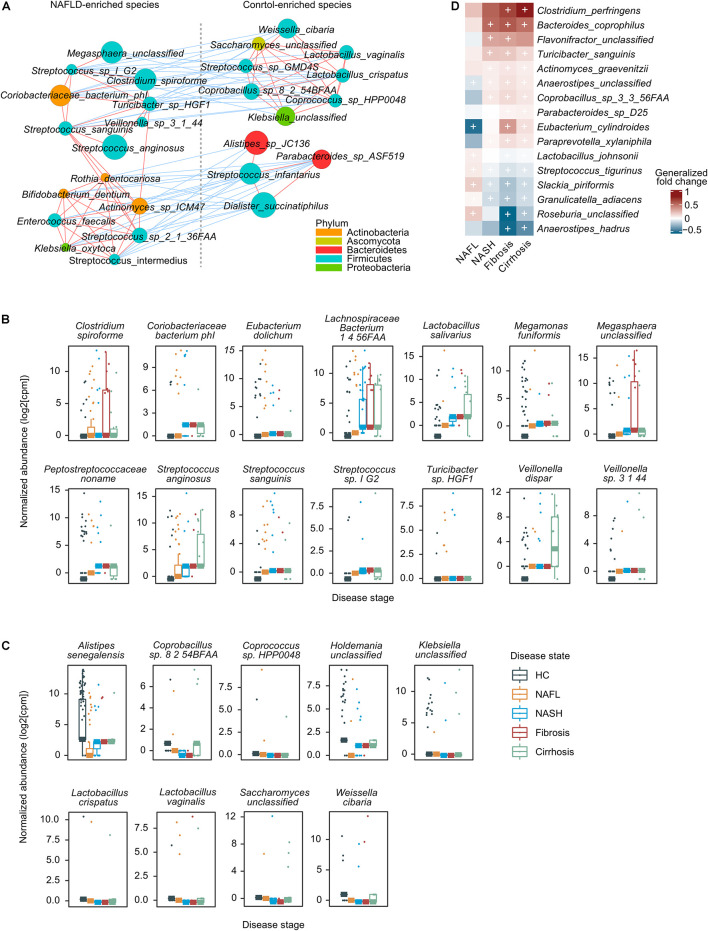
FIGURE 3.
A co-occurrence network and the correlation between gut microbes and NAFLD. (A) A co-occurrence network for the core set of highly significant species. The size of the nodes indicates normalized abundance. The color of the nodes indicates their taxonomic assignment. Connecting lines represent Spearman correlation coefficient values above 0.8 (red) or below −0.8 (blue). (B) Boxplots showing that species was significantly correlated with NAFLD stages using partial Spearman’s rank-based correlation (pSRC), adjusted for BMI (two-sided, FDR < 0.05). (C) Boxplots showing that species was significantly anti-correlated with NAFLD stages (pSRC, two-sided, FDR < 0.05). (D) Heatmap showing the species that significantly and consistently changed in the last three stages (blocked two-sided Wilcoxon tests, + indicates statistical significance FDR < 0.05). Generalized fold change is colored by direction of the effect, where red indicates higher abundance in patients and blue indicates depletion. HC, healthy controls; NAFL, non-alcoholic fatty liver; NASH, non-alcoholic steatohepatitis.

