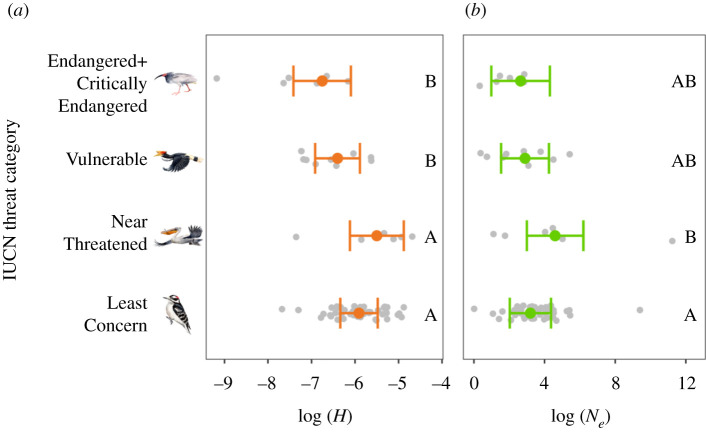
Figure 1.
Differences in heterozygosity (H) (a) and effective population size (Ne) (b) among IUCN threat categories based on estimates from separate multiple regression models that also included effects of habitat area, diet and body mass. Coloured points and error bars represent model predictions and 95% confidence intervals; raw data points are in grey. IUCN categories that do not share a letter are significantly different from each other based on post hoc Tukey's honestly significant difference tests. Drawings are example birds from each Red List category. Illustrated species are (top to bottom) crested ibis (Nipponia nippon), rhinoceros hornbill (Buceros rhinoceros), Dalmatian pelican (Pelecanus crispus) and downy woodpecker (Picoides pubescens). (Online version in colour.)

