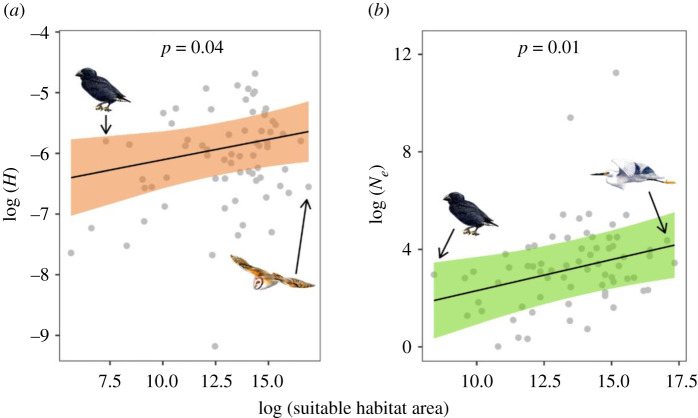
Figure 2.
Effect of suitable habitat area on heterozygosity (H) (a) and effective population size (Ne) (b) per species based on output from separate multiple regression models that also included effects of IUCN threat category, diet and body mass. Lines and shaded regions represent model predictions and 95% confidence intervals; raw data points are in grey. Drawings show examples of bird species with suitable habitat area near the minimum and maximum observed. Illustrated species are (left to right) medium ground finch (Geospiza fortis), barn owl (Tyto alba) and little egret (Egretta garzetta). (Online version in colour.)

