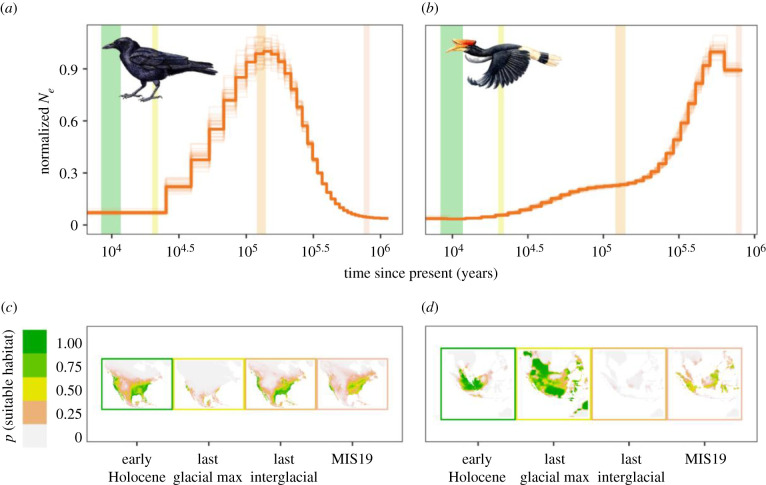
Figure 3.
Comparison of effective population size (Ne) trajectories over time with maps of suitable habitat area over the past approximately 1 Myr for two avian species (American crow (Corvus brachyrhynchos), (a,c), and rhinoceros hornbill (Buceros rhinoceros), (b,d)). Ne trajectories (dark orange lines) were obtained using PSMC and normalized by dividing all values by the maximum value. Light orange lines represent bootstrap PSMC replicates. Coloured vertical bars on the trajectories correspond to the four historical time periods represented in the maps, which have corresponding coloured borders. Estimates of past suitable habitat were obtained using ENM. Note that the PSMC parametrization (e.g. generation time, substitution rate) will shift the Ne trajectories vertically, and that recent estimates of Ne from PSMC tend to be noisy (i.e. there is more variance in Ne in shallow time) owing to fewer coalescent events. See the electronic supplementary material, S3 for similar plots for all 68 species analysed in this paper. (Online version in colour.)

