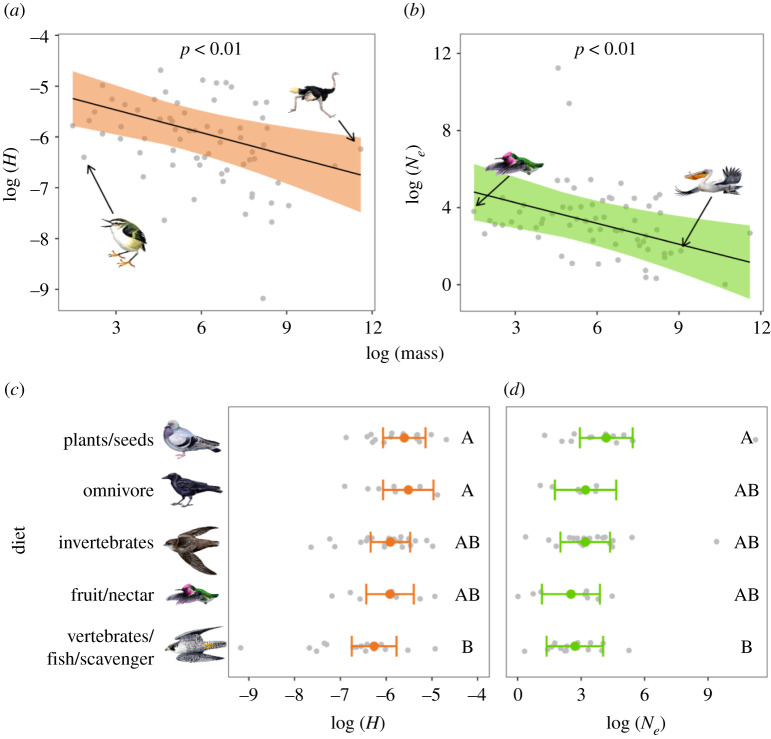
Figure 4.
Effect of life-history traits on heterozygosity (H) and mean effective population size (Ne) based on output from separate multiple regression models that also included effects of IUCN threat category and habitat area; (a,b) shows the relationship between body mass and H or Ne; lines and shaded regions represent model predictions and 95% confidence intervals (CIs). Illustrated species are (left to right) rifleman (Acanthisitta chloris), common ostrich (Struthio camelus), Anna's hummingbird (Calypte anna) and Dalmatian pelican (Pelecanus crispus); (c,d) shows the relationship between diet and H/Ne; coloured points and error bars represent model predictions with 95% CIs. Categories that do not share a letter are significantly different (p < 0.05) from each other based on post hoc Tukey's honestly significant difference tests. In all plots, raw data points are shown in grey. Drawings show examples of bird species with body mass near the minimum and maximum observed and from each Red List category. Illustrated species are (top to bottom) rock dove (Columba livia), American crow (Corvus brachyrhynchos), chimney swift (Chaetura pelagica), Anna's hummingbird (Calypte anna) and peregrine falcon (Falco peregrinus). (Online version in colour.)

