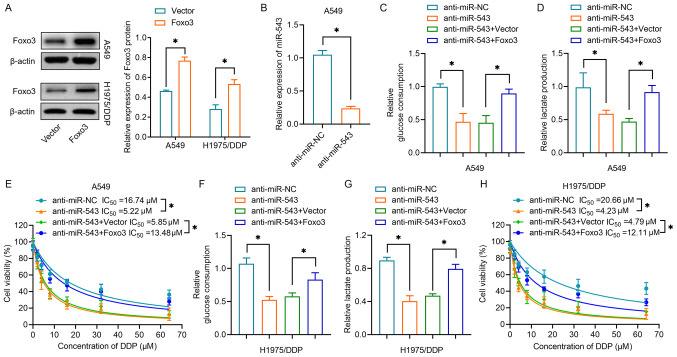
Figure 6.
Foxo3 overexpression reverses the effects of miR-543 silencing on glycolysis and cisplatin resistance. (A) Western blot analysis revealed the relative protein expression levels of Foxo3 in A549 and H1975/DDP cells transfected with Foxo3 or negative control vector. (B) Relative expression levels of miR-543 in A549 cells transfected with anti-miR-543 or anti-miR-NC. (C) Glucose consumption was determined in A549 cells transfected with Foxo3 vectors and/or anti-miR-543. (D) Lactate production of A549 cells transfected with Foxo3 vectors and/or anti-miR-543. (E) A CCK-8 assay was performed to determine cell proliferation following DDP treatment of A549 cells transfected with Foxo3 vectors and/or anti-miR-543. (F) Relative glucose consumption and (G) lactate production of H1975/DDP cells transfected with Foxo3 vectors and/or anti-miR-543. (H) A CCK-8 assay was performed to determine cell proliferation following DDP treatment of H1975/DDP cells transfected with Foxo3 vectors and/or anti-miR-543. *P<0.05. CCK-8, Cell Counting Kit-8; DDP, cisplatin; miR/miRNA, microRNA; NC, negative control.

