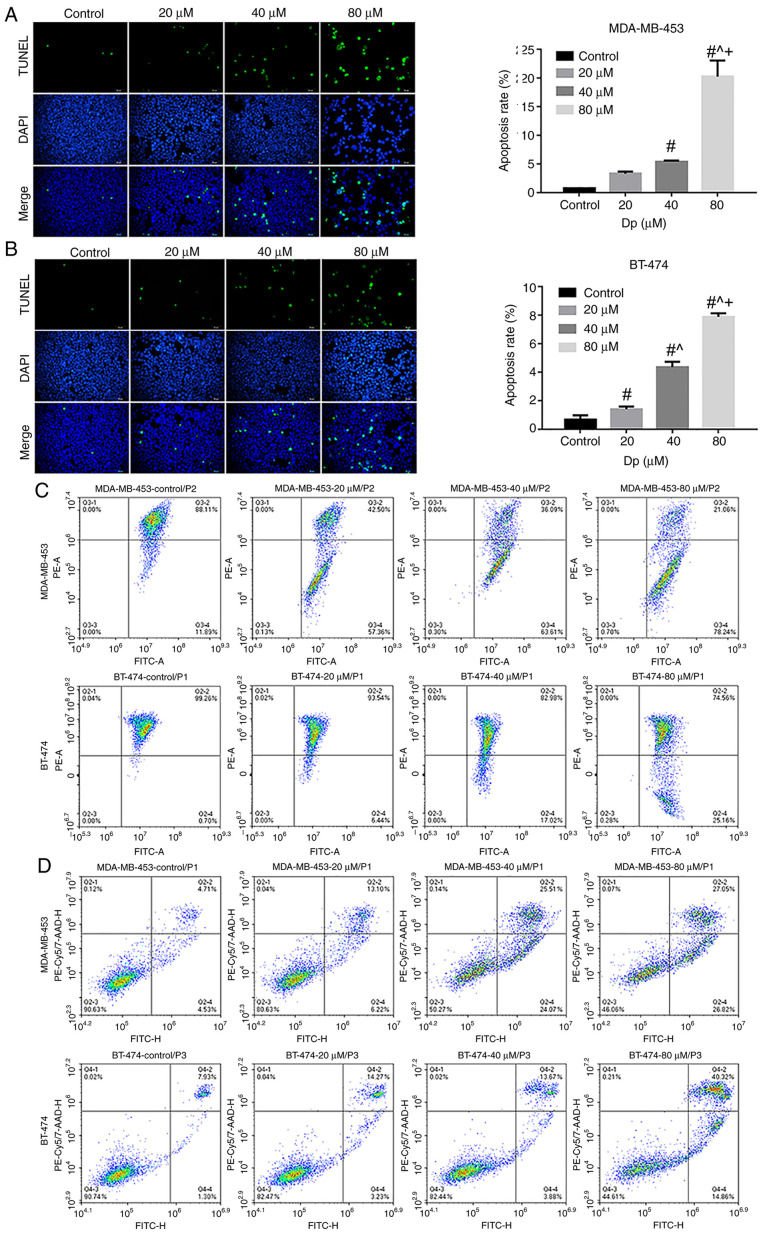
Figure 3.
Delphinidin induces apoptosis in the MDA-MB-453 and BT-474 cell lines. The cells were treated with 0, 20, 40 or 80 µM delphinidin or dimethyl sulfoxide for 48 h. Representative images of TUNEL-positive (A) MDA-MB-453 and (B) BT-474 cell lines and the data was statistically analyzed. The cells were treated with 0, 20, 40 or 80 µM delphinidin for 8 h. (C) Mitochondrial membrane potential was analyzed using flow cytometry. (D) Apoptosis was analyzed using flow cytometry. Magnification, ×200. n=3. #P<0.05 vs. control; ^P<0.05 vs. 20 µM; +P<0.05 vs. 40 µM.

