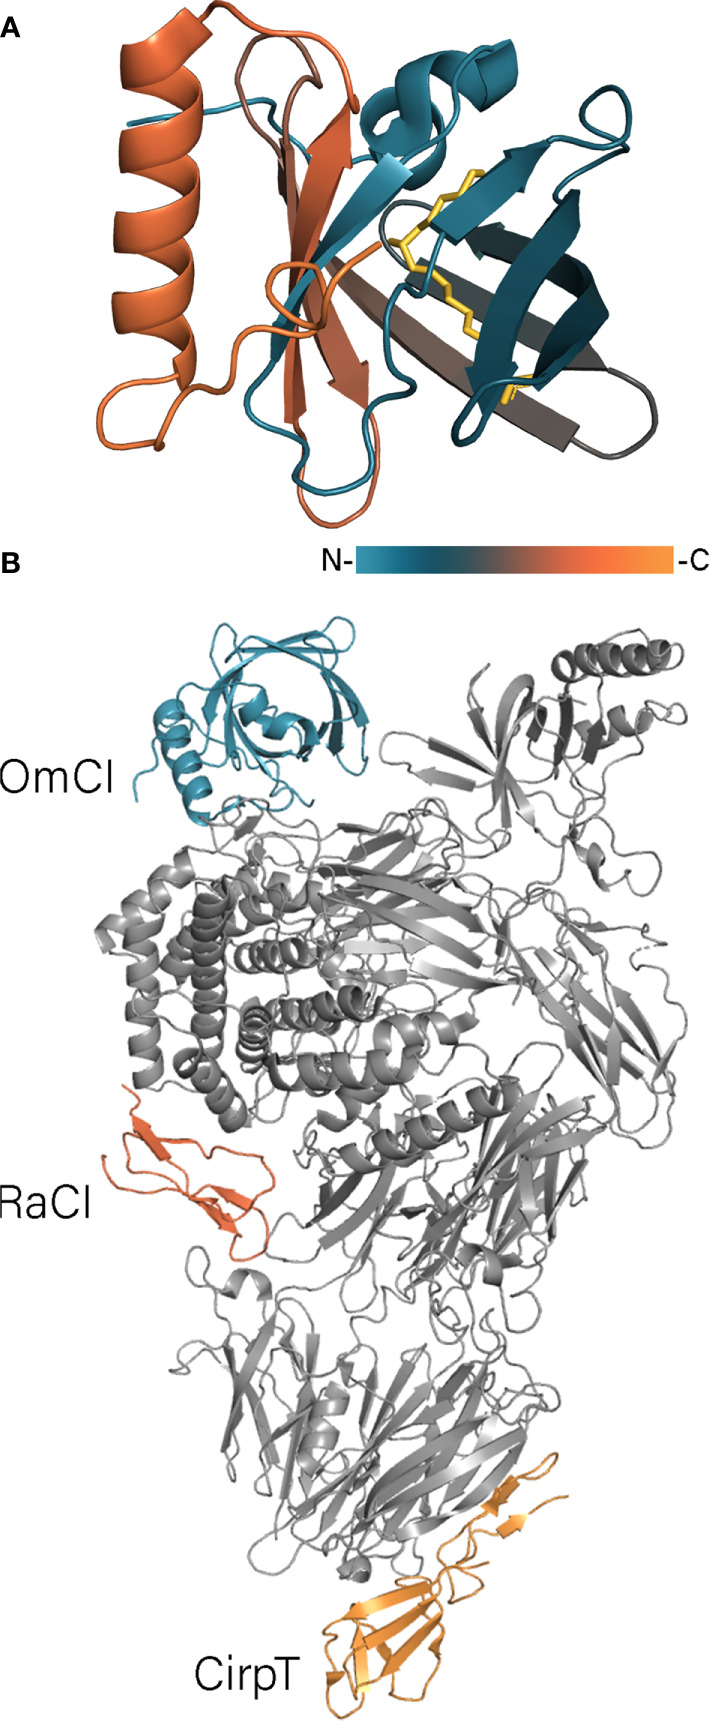
Figure 3.

(A) OmCI structure in the complex with ricinoleic acid (PDB: 2CM4). OmCI structure is colored according to a gradient, ricinoleic acids is shown in yellow. (B) The structure of C5 protein in the complex with OmCi, RaCI, and CirpT (PDB: 6RQJ). C5 is shown in grey, tick proteins – in color.
