Figure 2.
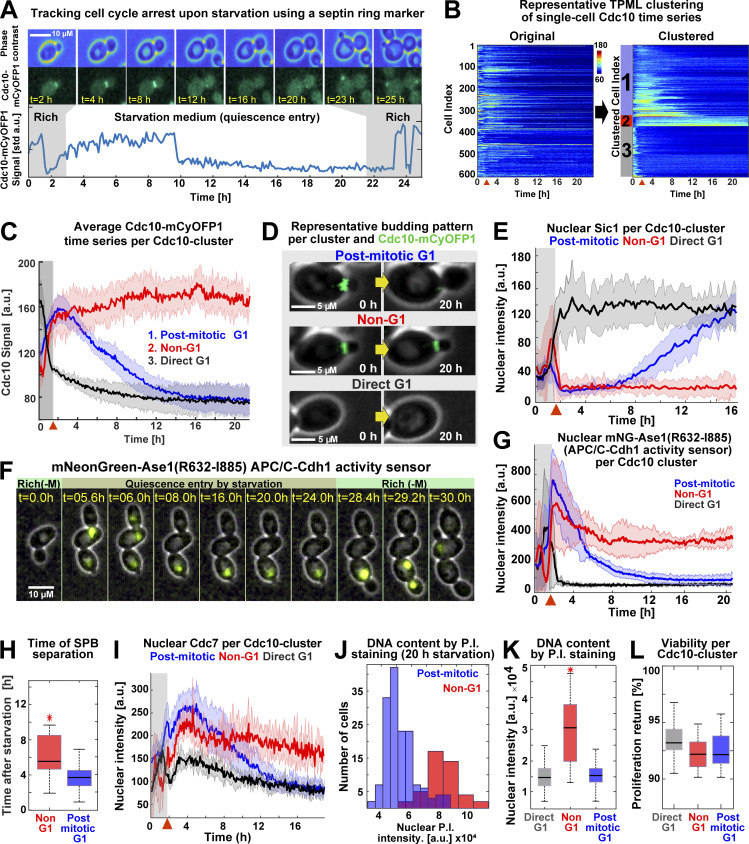
Acute starvation induces low- and high-Cdk1 quiescent states. (A) Schematic of cell cycle tracking during starvation using the septin Cdc10-mCyOFP1 signal (OAM421). (B) Representative heatmaps showing TPML arrangement of single-cell Cdc10 time series into Cdc10 clusters corresponding to the main patterns of cell cycle arrest upon starvation. (C) Average Cdc10 time series for each Cdc10 cluster (n = 6; 633 cells). (D) Representative micrographs of budding patterns per Cdc10 cluster during starvation. Maximum intensity projection (MIP) mCyOFP1 image superimposed on phase contrast. Yellow arrows represent passage of time. (E) Average nuclear Sic1 intensity per Cdc10 cluster (n = 3; 341 cells, OAM672). (F) Representative micrographs of the APC/C-Cdh1 activity sensor mNeonGreen-Ase1(R632-I885) during starvation in post-mitotic (up) and Non-G1 (down) Q-cells (OAM487). MIP mNeonGreen (mNG) image superimposed on phase contrast. Rich(−M), rich medium minus methionine. (G) Average mNeonGreen-Ase1(R632-I885) nuclear intensity per Cdc10 cluster (n = 3; 255 cells). (H) Time of SPB separation in Non-G1 and post-mitotic G1 Q-cells upon starvation (n = 3; 353 cells, OAM423). (I) Average Cdc7–mScarlet-I nuclear intensity per Cdc10 cluster (n = 3; 345 cells, OAM422). (J and K) Representative nuclear intensity histograms (J) and comparison of nuclear fluorescence intensity per Cdc10 cluster (K) after propidium iodide (P.I.) staining (n = 3; 304 cells, OAM421). (L) Average viability of cells in each Cdc10 cluster upon return to rich medium after 24 h of starvation (n = 3; 565 cells, OAM421). All data from biological replicates. Red arrowhead = onset of starvation. Solid lines with shaded area = average ± 95% confidence intervals. Red star = P < 0.05, K-S test. Box plots display data from biological replicates: central mark, median; box bottom and top limits, 25th and 75th percentiles; whiskers, most extreme nonoutlier values. std, SD.

