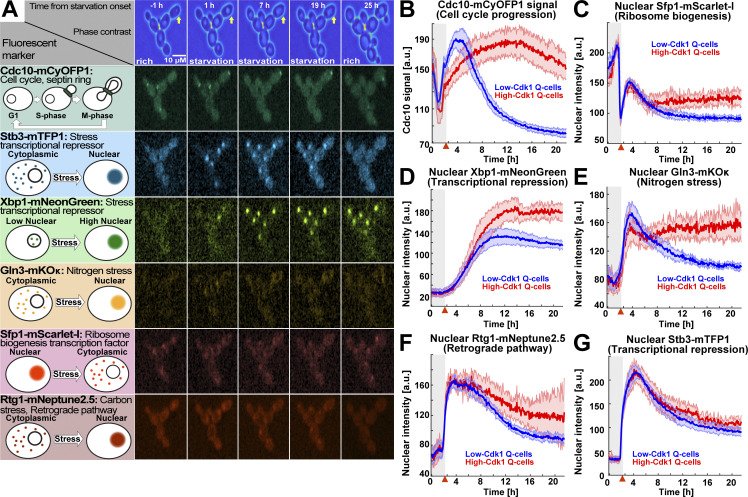
Figure 3.
The stress transcription factors Sfp1, Gln3, and Xbp1 are selectively up-regulated during high-Cdk1 quiescence entry. (A) Left: Schematic nuclear accumulation of fluorescently tagged transcription factors used as sensors for stress responses. Right: Representative MIP micrographs of the six fluorescent channels imaged in 6C1 cells upon starvation. Yellow arrow = high-Cdk1 Q-cell. (B–G) Quantification of cell cycle progression and stress responses in low-Cdk1 (blue) or high-Cdk1 (red) Q-cells upon starvation (n = 9; 825 cells, OAM425). (B) Average Cdc10-mCyOFP1 time series per cluster. (C) Average nuclear intensity of the ribosome biogenesis factor Sfp1–mScarlet-I per cluster. (D) Average nuclear intensity of the transcriptional repressor Xbp1-mNeonGreen per cluster. (E) Average nuclear intensity of the nitrogen stress response regulator Gln3-mKOκ per cluster. (F) Average nuclear intensity of the carbon/retrograde pathway regulator Rtg1-mNeptune2.5 per cluster. (G) Average nuclear intensity of the transcriptional repressor Stb3-mTFP1 per cluster. Red arrowheads = onset of starvation. Solid lines with shaded area = average ± 95% confidence intervals.

