Figure 8.
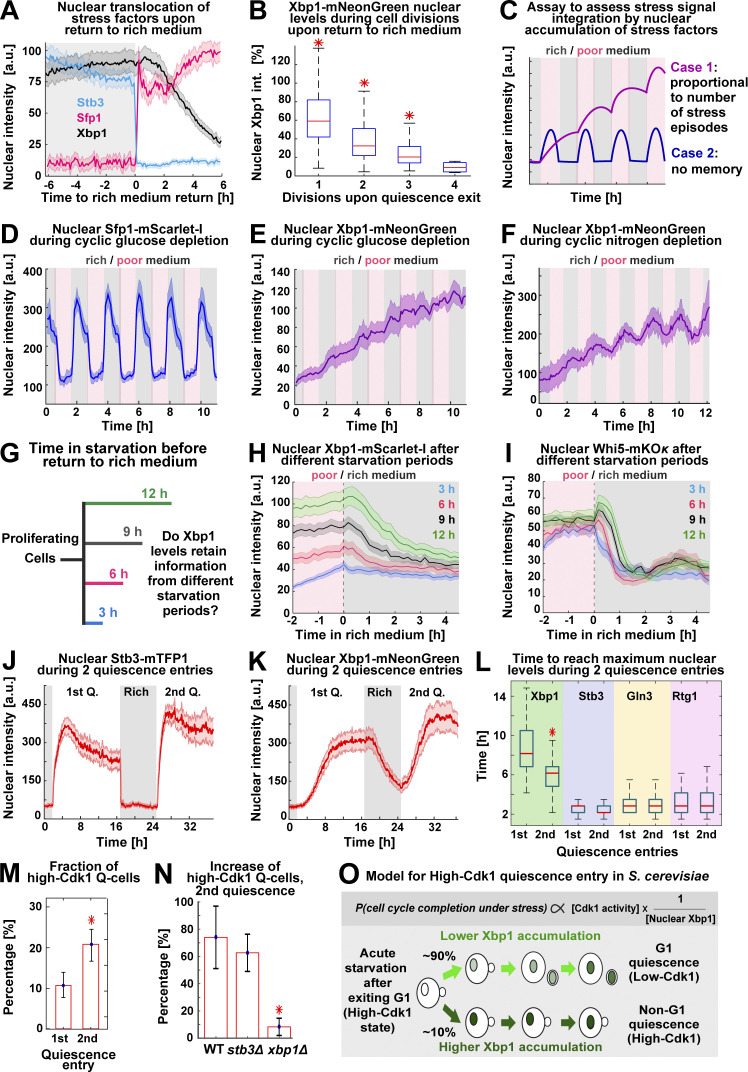
Xbp1 acts as a time-delayed integrator of stress stimuli. (A) Average nuclear intensity of Sfp1–mScarlet-I, Stb3-mTFP1, and Xbp1-mNeonGreen as percentage of their maximum nuclear accumulation ±6 h around transfer to rich medium (n = 6; 210 cells, OAM425). (B) Box plots of nuclear Xbp1 intensity as percentage of nuclear Xbp1 intensity (int.) at 20-h starvation, during cell divisions after return to proliferation (n = 6; >101 cells, OAM425). (C) Schematic assay to assess stress stimuli integration by nuclear accumulation of stress factors. (D and E) Average nuclear Sfp1 (D) and Xbp1 (E) intensity during hourly episodes of glucose depletion (n = 5; 335 cells). (F) Average nuclear Xbp1 intensity during hourly episodes of nitrogen depletion (n = 5; 235 cells, OAM425). (G) Schematic assay to assess the integration of starvation duration by nuclear accumulation of stress factors. (H) Nuclear Xbp1–mScarlet-I average intensity in cells transferred to rich medium after different starvation periods (n = 3; >89 cells, OAM849) (I) Nuclear Whi5-mKOκ average intensity in cells transferred to rich medium after different starvation periods (n = 3; >64 cells, OAM850). (J and K) Average nuclear intensity of Stb3 (J) and Xbp1 (K) during two consecutive quiescence (Q) entries (n = 4; 310 cells, OAM425). (L) Box plots of time to reach maximum nuclear intensity by stress factors during two quiescence entries (n = 4; 310 cells, OAM425). (M) Percentage of high-Cdk1 Q-cells during two consecutive quiescence entries (n = 4; 310 cells, OAM425). (N) Percentage increase of high-Cdk1 Q-cells during two consecutive quiescence entries in WT (OAM421), stb3Δ (OAM851), and xbp1Δ cells (OAM852; n > 3; at least 350 cells). (O) Schematic model of high-Cdk1 quiescence entry. Top: Probability of cell cycle completion under starvation (P) is proportional to Cdk1 activity (given by cell cycle stage at starvation onset) and inversely proportional to nuclear Xbp1 levels (given by single-cell history). Bottom: Depending on Xbp1 accumulation, cells with identical cell cycle progression at starvation onset enter different quiescence states. Solid lines with shaded area = average ± 95% confidence intervals. Red star = P < 0.05, K-S test. Bar plots = mean ± SD. Box plots display data from biological replicates: central mark, median; box bottom and top limit, 25th and 75th percentiles; whiskers, most extreme nonoutlier values.

