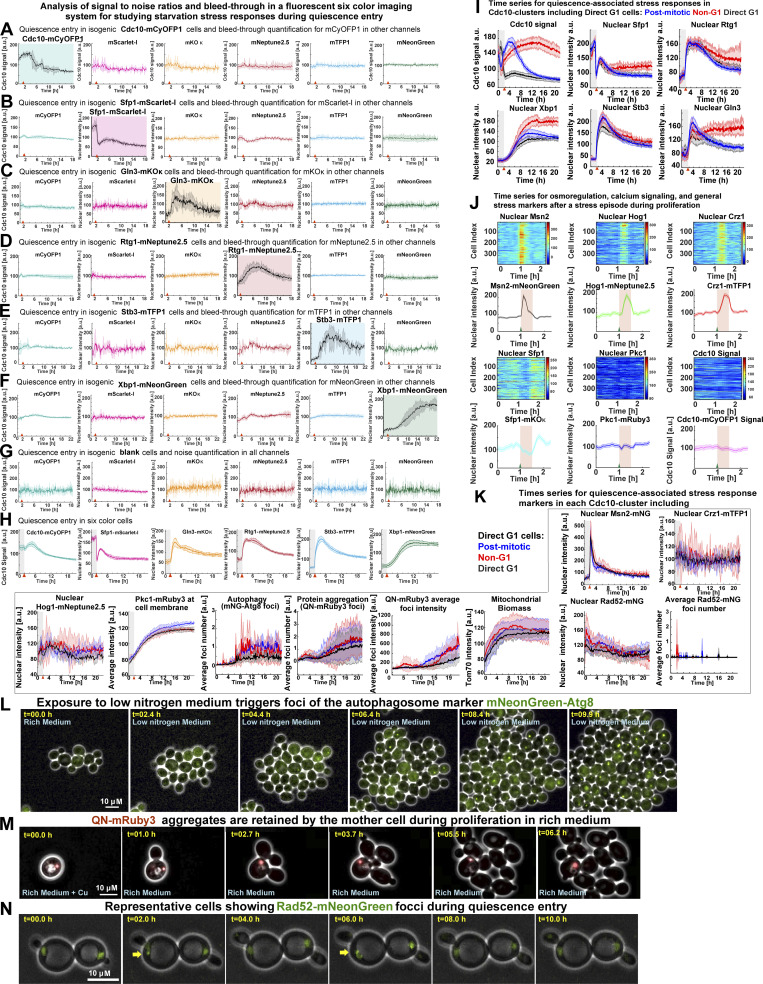
Figure S2.
Analysis of signal-to-noise ratios and bleed-through in the six-color imaging system, analysis of osmoregulatory responses in 6C2 cells, and detection of mNeonGreen (mNG)-Atg8, QN-mRuby3, or Rad52-mNeonGreen foci. (A–H) Assessment of signal-to-noise ratios and bleed-through in a six-color fluorescent microscopy system by imaging quiescence entry in isogenic single fluorophore–tagged strains for Cdc10-mCyOFP1 (OAM421; A) and the stress markers Sfp1–mScarlet-I (OAM407; B), Gln3-mKOκ (OAM507; C), Rtg1-mNeptune2.5 (OAM510; D), Stb3-mTFP1 (OAM395; E), Xbp1-mNeonGreen (OAM397; F), and isogenic blank cells (OAM128; G) or an isogenic six-color strain (OAM425; H); at least 75 cells per strain were analyzed from three different biological replicates; each channel is normalized to a mean of 100 a.u. Plot with colored background = channel containing a fluorescent signal. Plot with white plot background = channel without a fluorescent signal. Red arrowhead = onset of starvation. (I) Average time series for Cdc10 clusters, including direct G1 cells, for the cell cycle marker Cdc10-mCyOFP1 and the stress response factors Sfp1–mScarlet-1, Rtg1-mNeptune2.5, Xbp1-mNeonGreen, Stb3-mTFP1, and Gln3-mKOκ. (J) Up-regulation of osmotic/mechano-sensitive stress responses by 200 mM CaCl2 in unsynchronized 6C2 cells (OAM667) bearing the stress markers Crz1-mTFP1, Pkc1-mRuby3, Msn2-mNeonGreen, Sfp1-mKOκ, Hog1-mNeptune2.5, and Cdc10-mCyOFP1. Heatmaps display unsynchronized single-cell time series. The plots display average time series (n = 4; 364 cells). Red area, period in 200 mM CaCl2-containing rich medium. Green triangle, onset of CaCl2 exposure. (K) Average time series for quiescence-associated stress responses in Cdc10 clusters, including the nuclear accumulation of Msn2, Crz1, Hog1, and Rad52; the cell membrane association of Pkc1; up-regulation of mNeonGreen-Atg8; and QN-mRuby3 foci or Tom70-mTFP1 total intensity. (L) Representative micrographs showing the accumulation of the autophagy reporter mNeonGreen-Atg8 upon proliferation in low-nitrogen medium (SCD without ammonium sulfate, OAM654). (M) Representative time-lapse micrographs of a mother cell retaining a fluorescent QN-mRuby3 aggregate during proliferation in rich medium after 2 h in 25 µM CuSO4-containing SCD (OAM671). (N) Representative time-lapse micrographs of cells (OAM670) with recurring Rad52-mNeonGreen foci (yellow arrows) during starvation. Solid lines with shaded area = average ± 95% confidence intervals. Red arrowhead = onset of starvation.

