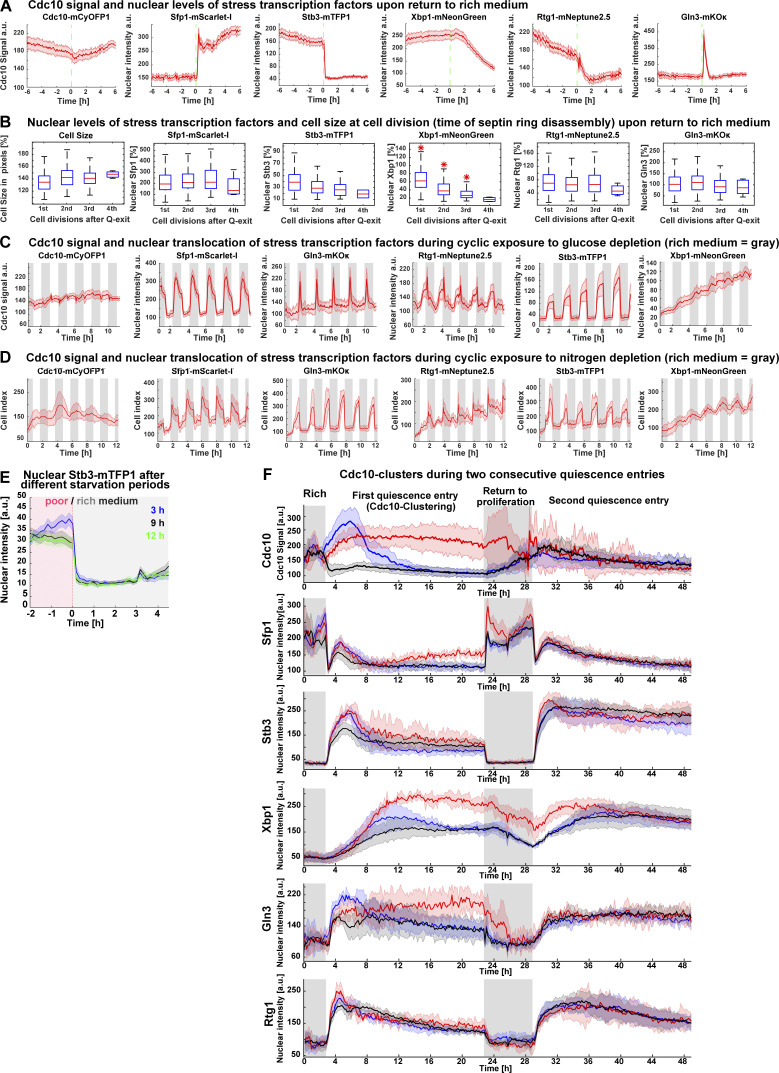
Figure S5.
Analysis of nuclear translocation of stress transcription factors upon return to rich medium and during cyclic episodes of glucose/nitrogen depletion or two consecutive quiescence entries. (A) Average time series for cell cycle (Cdc10 signal) and stress markers (Sfp1, Rtg1, Gln3, Stb3, and Xbp1) during return to proliferation in 6C1 cells (n = 6; OAM425); green dotted line, transfer from starvation to rich medium. (B) Nuclear intensity of Sfp1, Stb3, Xbp1, Rtg1, and Gln3 and cell size expressed as percentage of their values at 20 h of starvation, during cell divisions upon return to rich medium (n = 4; >101 cells, OAM425). (C) Average times series for cell cycle (Cdc10-mCyOFP1) or nuclear stress markers (Sfp1, Gln3, Rtg1, Stb3, and Xbp1) during hourly cycles of glucose depletion (n = 5; 335 cells, OAM425). (D) Average times series for cell cycle (Cdc10-mCyOFP1) or nuclear stress markers (Sfp1, Gln3, Rtg1, Stb3, and Xbp1) during hourly cycles of nitrogen depletion (n = 5; 235 cells, OAM425). (E) Average nuclear Stb3-mTFP1 intensity in cells transferred to rich medium after different starvation periods (n = 3; >71 cells, OAM395). (F) Average of Cdc10 clusters for cell cycle (Cdc10-mCyOFP1) and stress markers (Sfp1, Stb3, Xbp1, Gln3, and Rtg1) during two consecutive quiescence entries (n = 3; 354 cells). Cdc10 clusters were established according to the first quiescence entry; only cells present during the first quiescence entry are included. Gray rectangles = period in rich medium. Solid lines with shaded area = average ± 95% confidence intervals. Red star = P < 0.05, K-S test. Box plots display data from biological replicates: central mark, median; box bottom and top limit, 25th and 75th percentiles; whiskers, most extreme nonoutlier values. Q-exit, quiescence exit.

