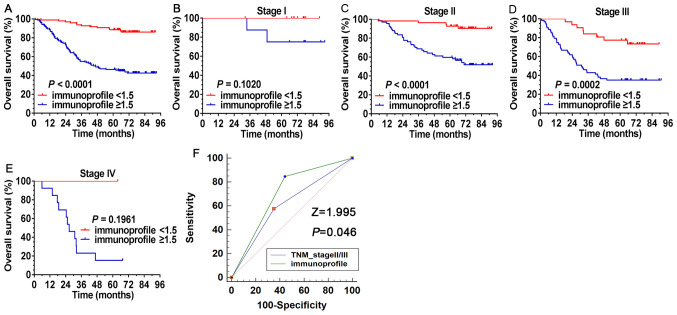
Figure 4.
Survival analysis of the immunoprofile based on CD8+ tumor-infiltrating lymphocytes and CD33+ myeloid-derived suppressor cells. (A) Based on the immunoprofile, all patients (n=249) were divided into different risk subgroups, regardless of TNM stage, with a cutoff value of 1.5. (B-E) The immunoprofile separated contemporaneous patients into different risk subgroups, particularly for patients with TNM stage II/III, who exhibited a significant separation. (B) TNM stage I, (C) TNM stage II, (D) TNM stage III and (E) TNM stage IV. (F) ROC curves were compared between the immunoprofile and the TNM stage system in patients with stage II/III colorectal cancer (n=216). The Z-statistic value of the pairwise comparison of the ROC curves was 1.995, with a statistically significant difference (P=0.046). ROC, receiver operating characteristic.

