Figure 15.

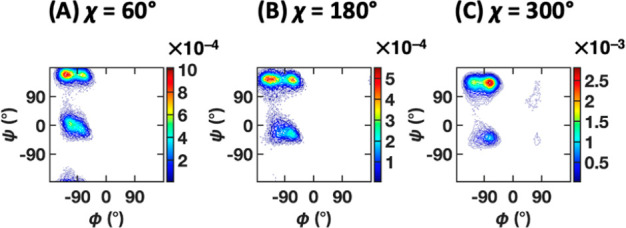
Density contour plots of subsets of the valine dipeptide trajectory corresponding to (A) χ = 60°, (B) χ = 180°, and (C) χ = 300°. Note the slightly different positions of the major state density peaks.

Density contour plots of subsets of the valine dipeptide trajectory corresponding to (A) χ = 60°, (B) χ = 180°, and (C) χ = 300°. Note the slightly different positions of the major state density peaks.