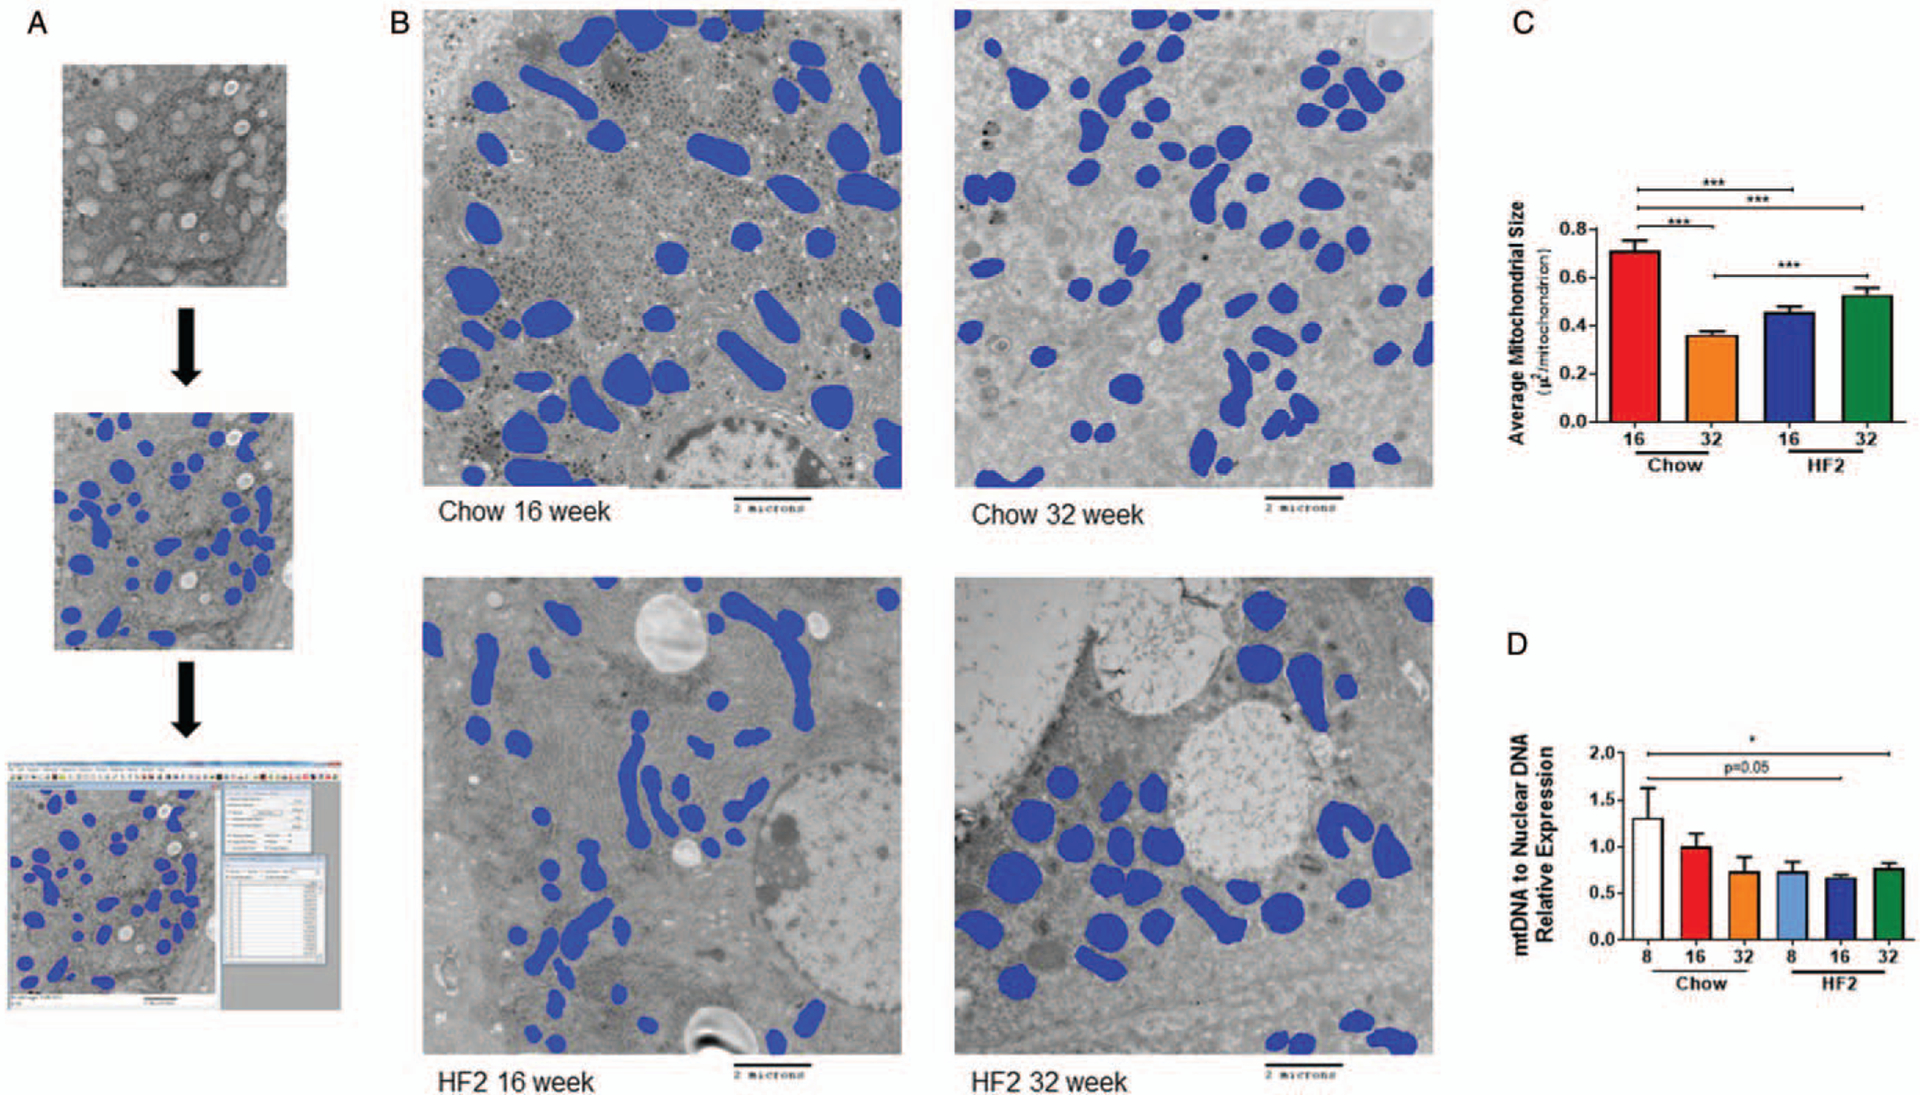
FIGURE 2.

Six to eight weeks old male C57Bl6/J mice fed on high-fat high carbohydrate (HF2) diet for 32 weeks. (A) Graphical illustration of mitochondria surface area measurement using ImagePro Plus 7.0 after digital electron microscopy. (B) Representative digital electron microscopy image of liver section from chow-fed and HF2-fed mice at 16th week and 32nd week on diet. (C) HF2-fed mice have a lower average mitochondrial surface area in the liver compared to chow-fed mice at 16th week of the diet. (D) HF2-fed mice have lower mitochondrial DNA to nuclear DNA ratio compared to chow-fed mice. Mean ± SEM. ***P < 0.001; *P < 0.05.
