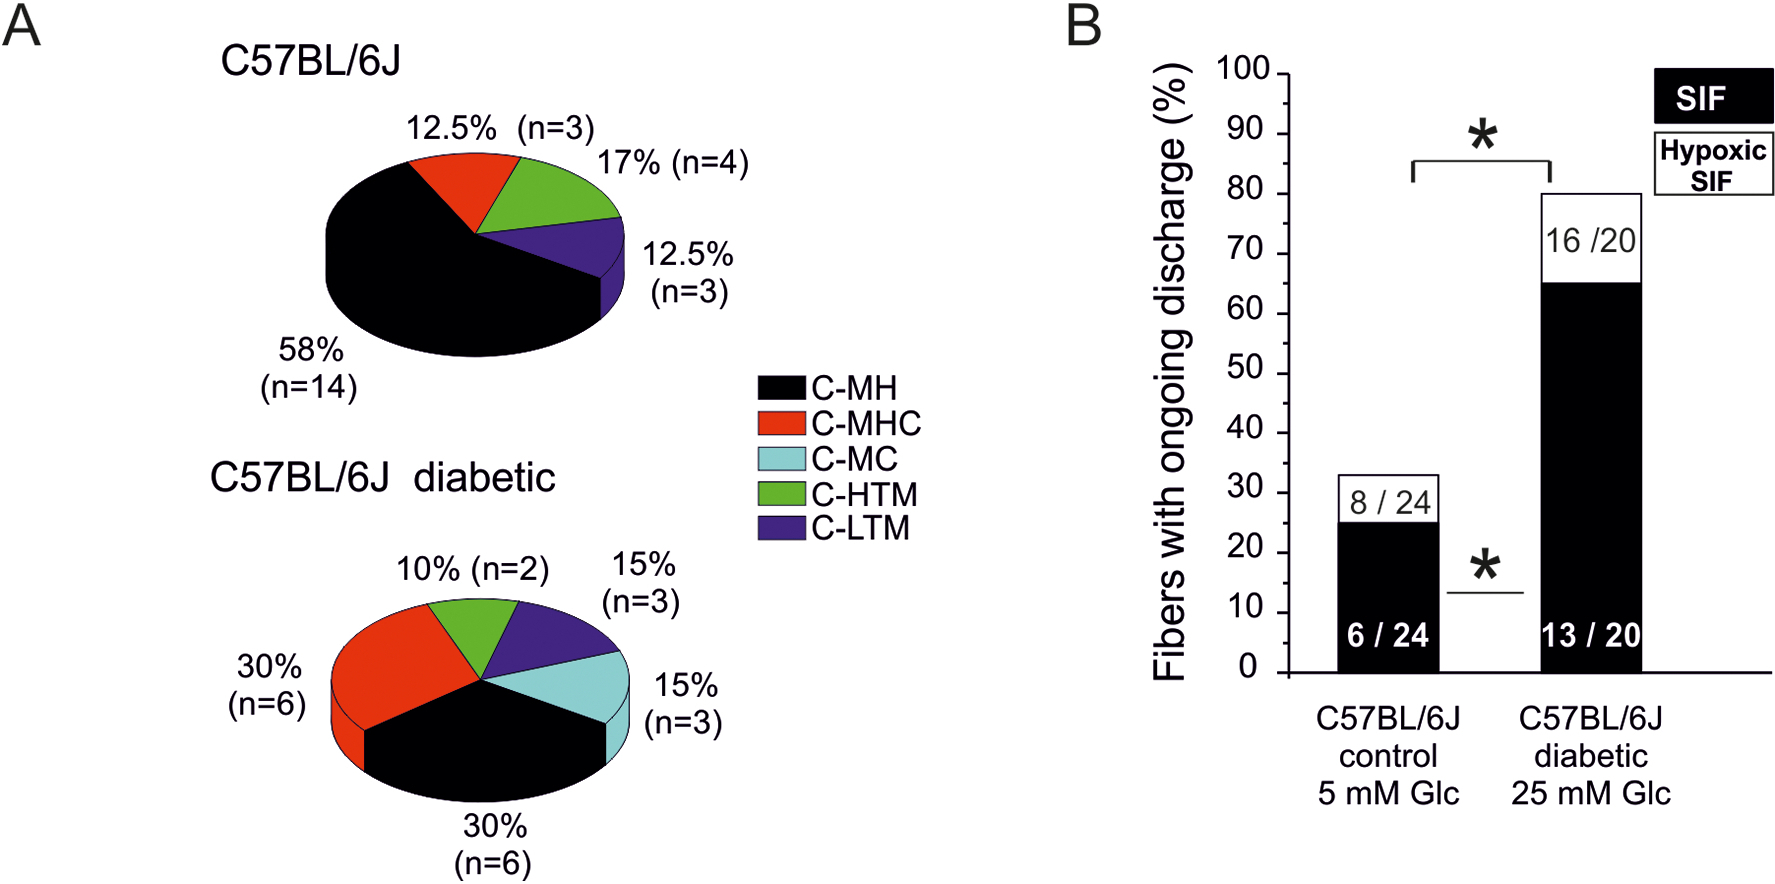
Fig. 2: Diabetes-induced changes in C-fiber sensitivities and spontaneous activity - single-fiber recordings from hairy hindpaw skin.

A. Distribution of sensory C-fiber subclasses in healthy versus diabetic C57BL/6J mice: MH = mechano-heat, MHC = mechanoheat-cold, MC = mechano-cold, HTM = high-threshold mechano-, LTM = low-threshold mechano-sensitive. B. Incidence (% of fibers) of spontaneous discharge activity (after sensory testing) in healthy versus diabetic C57BL/6J mice and its increment during 10 min hypoxia. Significant difference between healthy and diabetic preparations is marked with an asterisk based on ANOVA repeated measurements.
