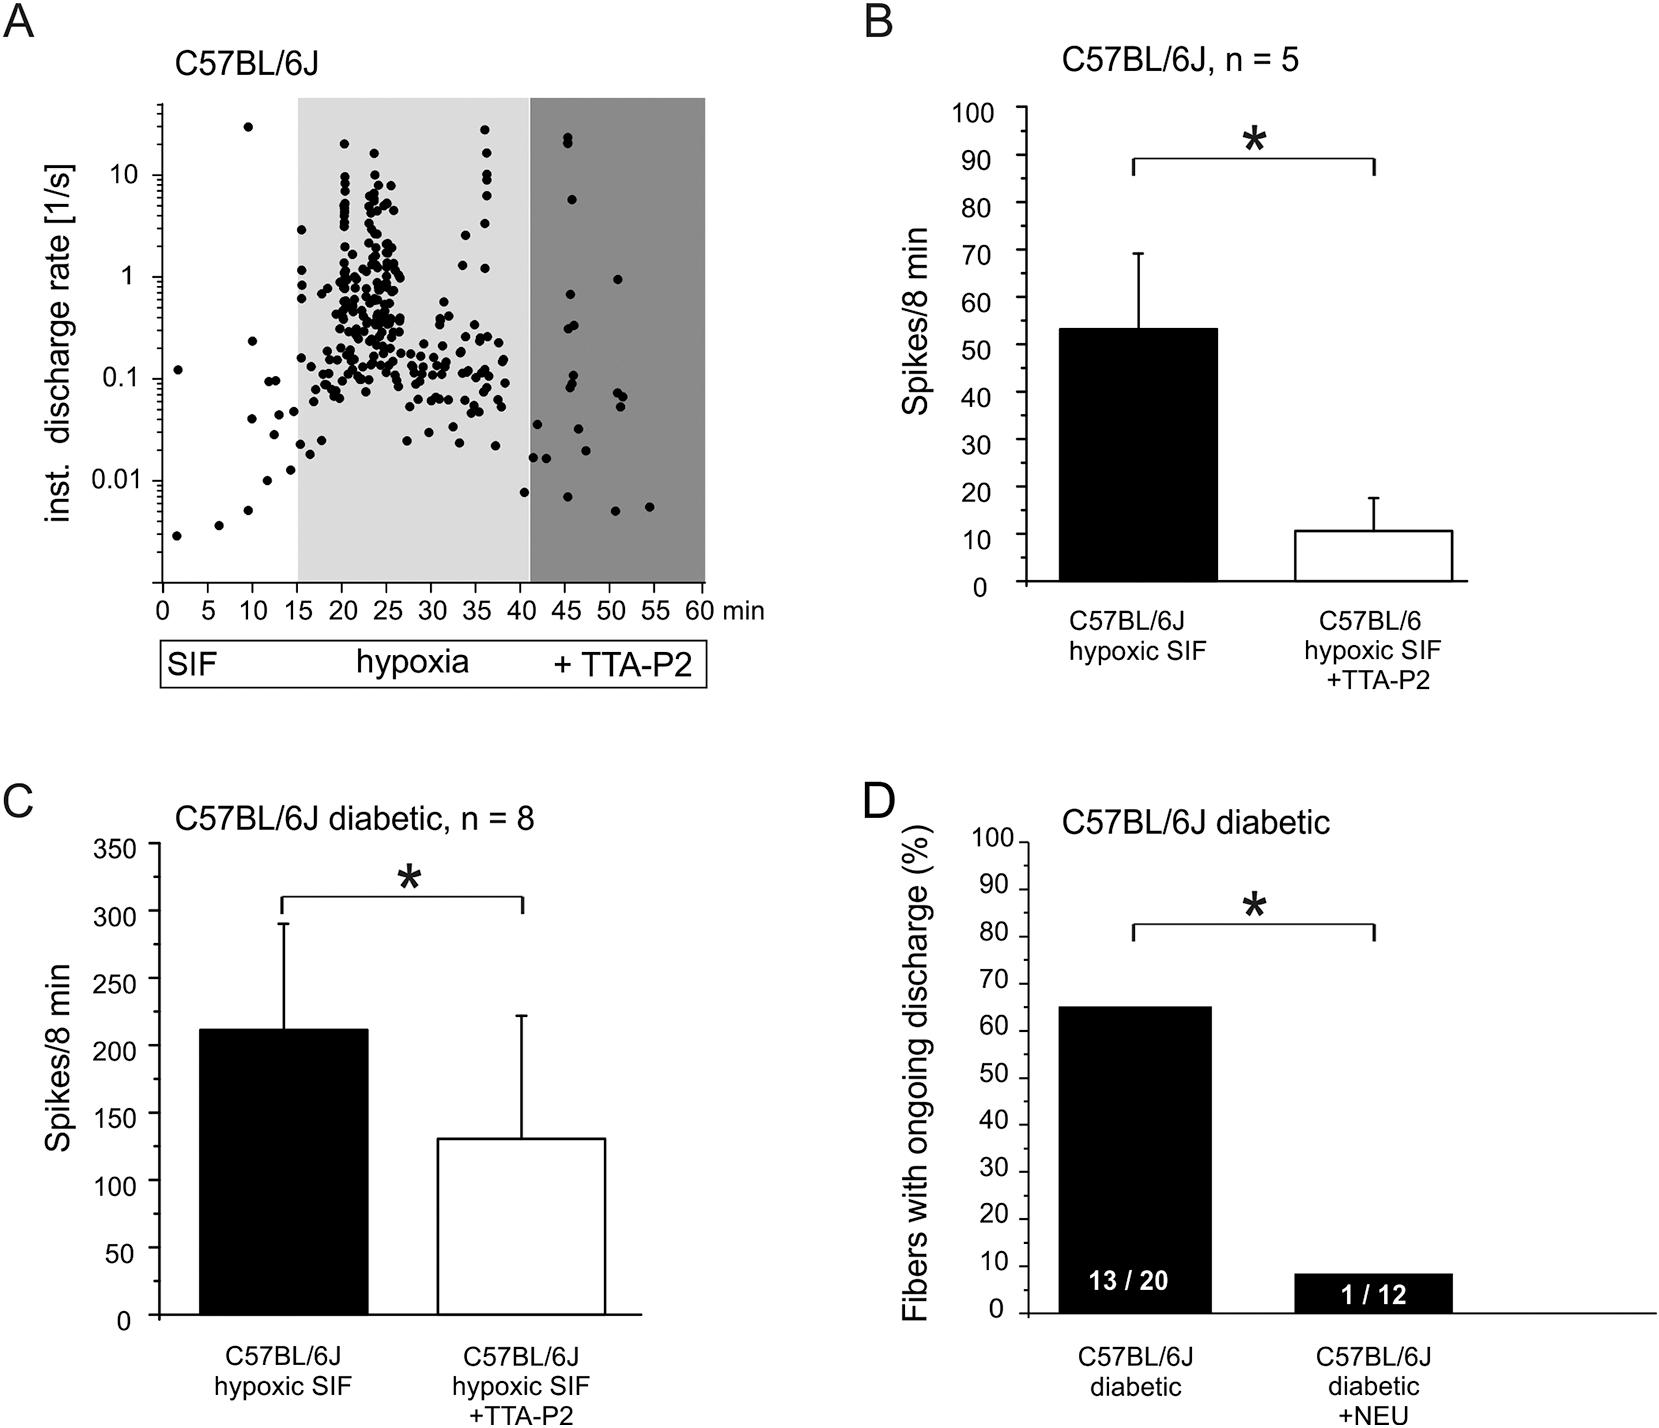
Fig. 6: Pharmacological effects on spontaneous C-fiber activity of healthy versus diabetic C57BL/6J.

A. Single-fiber example of ongoing discharge intensified by hypoxia and inhibitory effect of CaV3.2 blocker TTA-P2. B. Mean ongoing discharge in final 8 min of hypoxia and subsequent inhibitory effect of TTA-P2. C. As in B but diabetic animals. D. Incidence (% of fibers) of spontaneous activity among C-fibers of diabetic skin (from Fig. 3B) versus diabetic skin after de-glycosylation pretreatment with neuraminidase. Significant differences between experimental groups are marked with an asterisk based on ANOVA repeated measurements.
