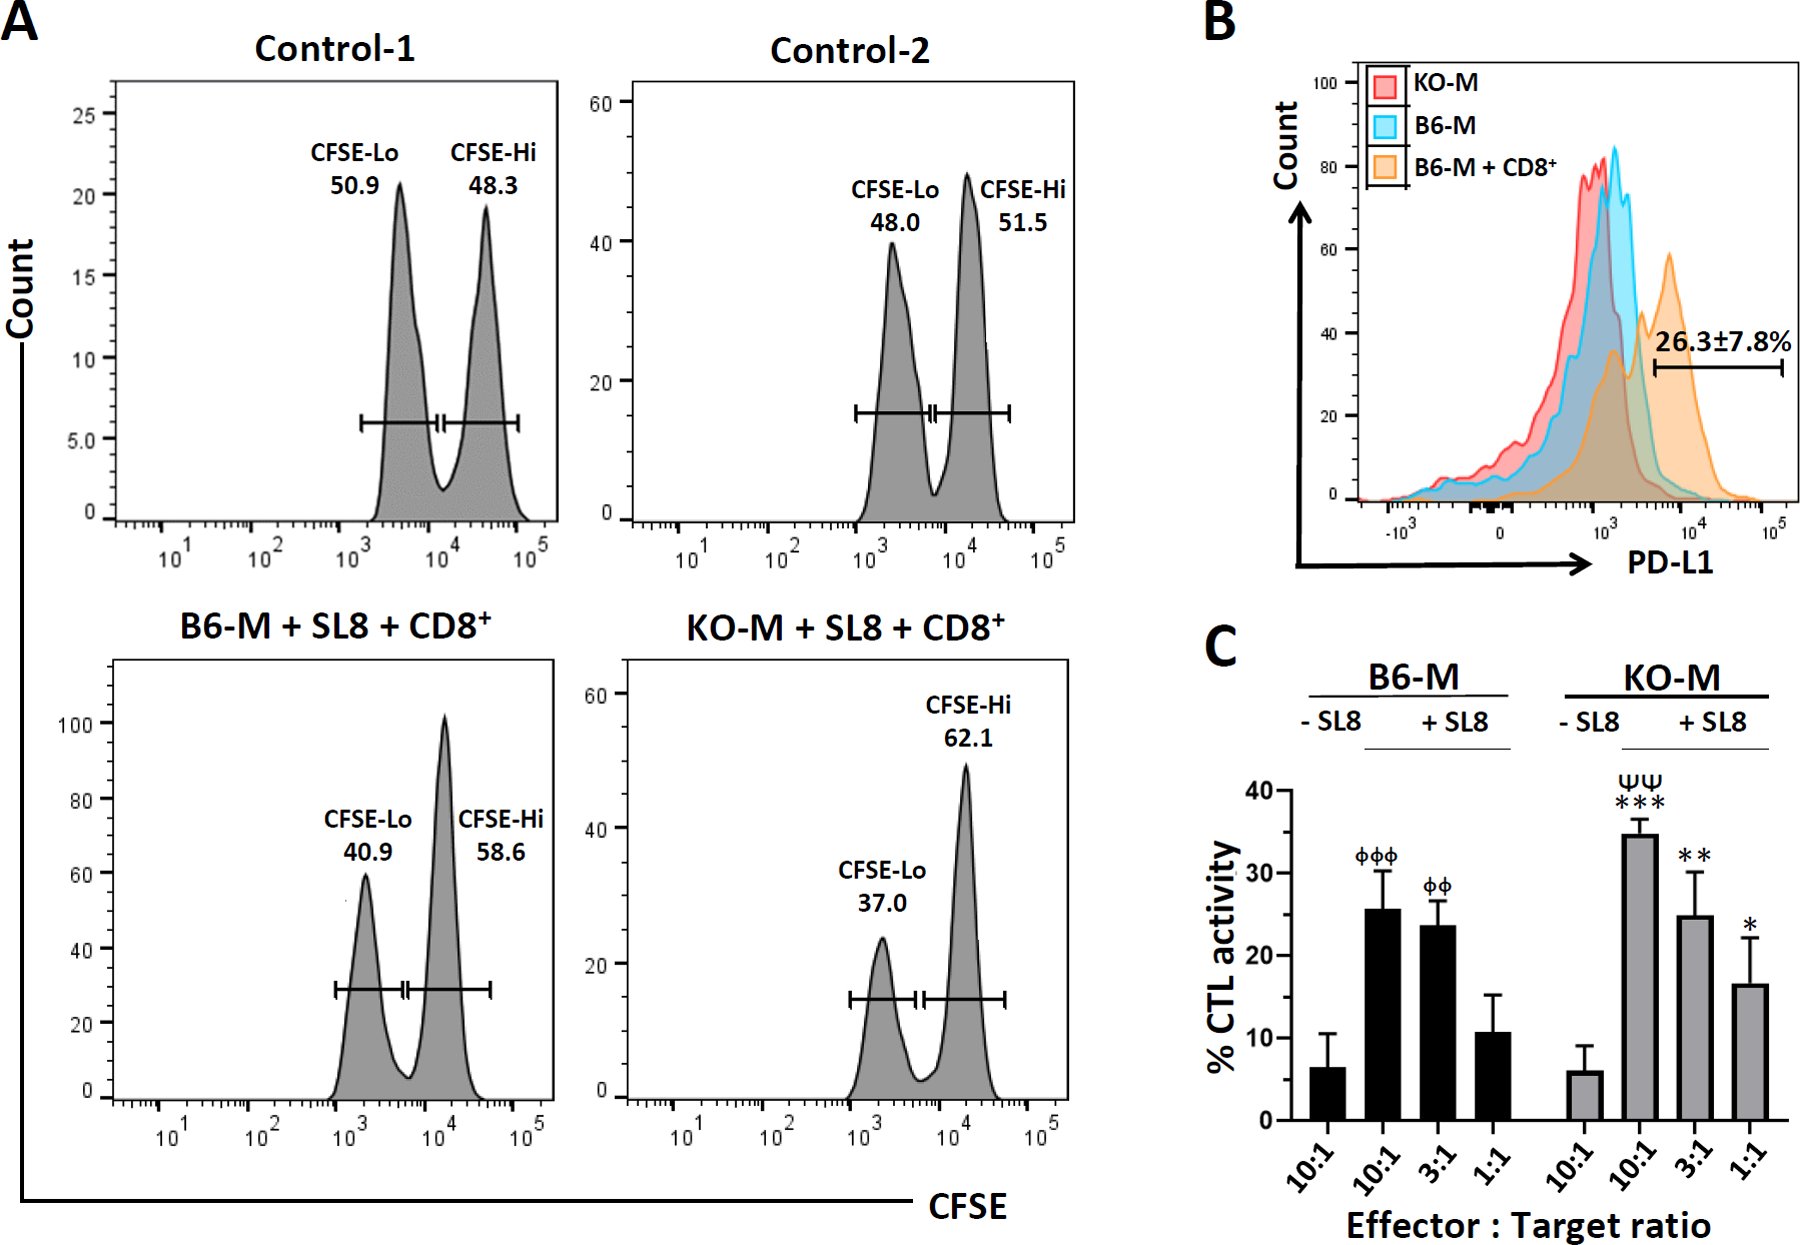
FIGURE 2.

In vitro microglial cell cytotoxicity assays. CD8+ T-cells were isolated from the spleens of rAd5-OVA-primed OT-1 mice using a negative selection kit. CD8+ T-cells were then transferred to microglial cell cultures (10:1, 3:1, and 1:1 effector: target ratios) from WT C57BL/6 (B6-M) or PD-L1 KO (KO-M) loaded with ovalbumin-specific SIINFEKL peptide (SL8) and labeled with CFSE. in vitro cytotoxicity was determined after 18 hr. (a) Representative histograms show CFSE labeled microglia harvested from the plate after 18 hr of co-culture with OT-1 CD8+ T-cells (10:1 effector: target ratio). Control-1 is the CFSE staining control representative of either B6-M or KO-M. Control-2 is the representative histogram of either B6-M or KO-M without peptide. (b) Histogram overlay showing expression of PD-L1 on microglia from PD-L1 KO (KO-M), C57BL/6 (B6-M), and C57BL/6 animals after co-culture with CD8+ T-cells (B6-M + CD8+). The experiment was performed twice in triplicate wells and data are expressed as mean ± SE on the representative histogram. (c) Graphical representation of % CTL activity [1 − (control group hi/lo ratio: experimental group hi/lo ratio)] × 100. p < .01 compared to B6-M + SL8 at 10:1 effector: target ratio. ᶲᶲp < .01 and ᶲᶲᶲp < .001 compared to B6-M − SL8. **p < .01 and ***p < .01 compared to KO-M-SL8. Data shown are representative of three experiments
