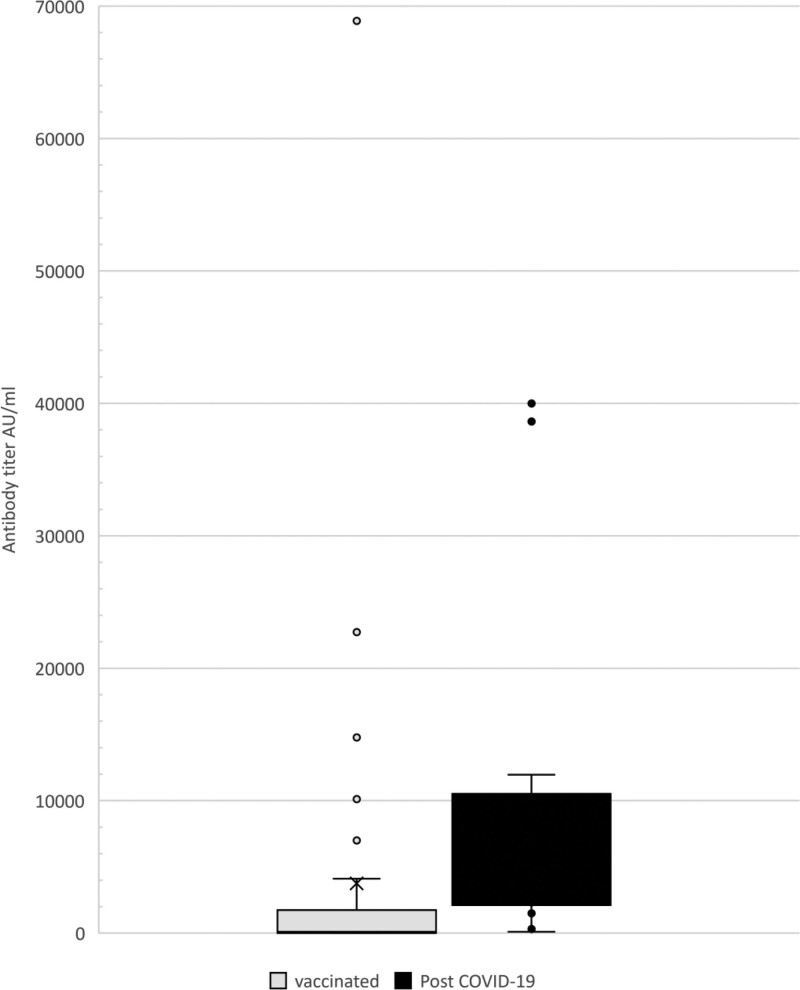
FIGURE 2.
Comparison of severe acute respiratory syndrome coronavirus 2 antibody titers in kidney transplant recipients, between those who were vaccinated and those who were post–COVID-19 infection. Antibody titer is shown in gray for vaccinated patients and black for post–COVID-19 patients. The solid line represents median titer level; X represents mean titer level; the boxes represent the interquartile range; whiskers represent the lowest and highest values within the range. Additional dots represent outliers that are 1.5 times above the third quartile. AU, antibody unit; COVID-19, coronavirus disease 2019.

