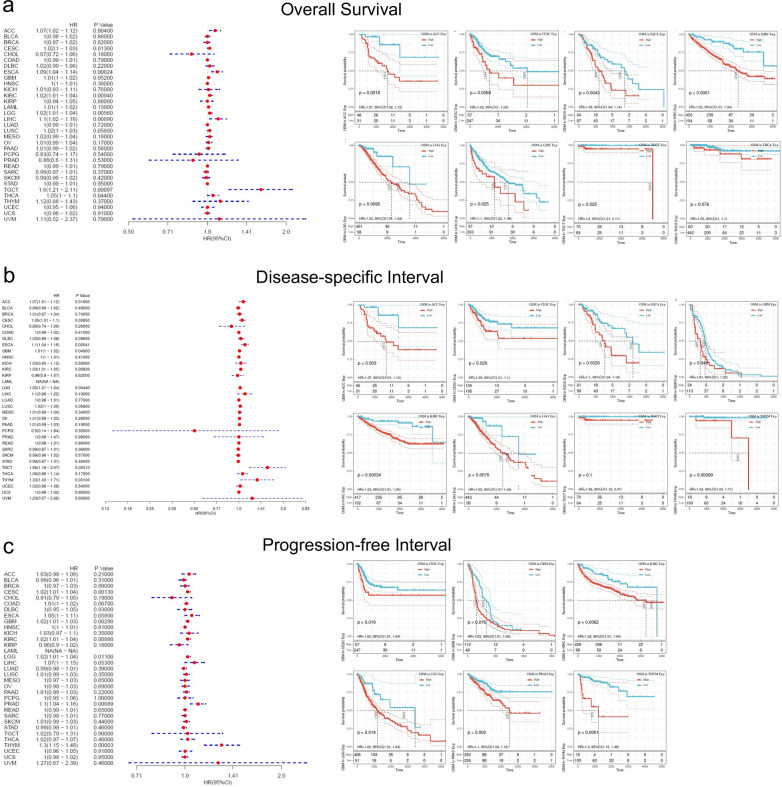
Fig. 2.
Correlation analysis between OSM level and overall survival, disease-specific survival, and progression-free interval in cancer patients based on TCGA database. a Forest plot to describe OSM-related overall survival of cancer patients and Kaplan–Meier curves for overall survival analysis in ACC, CESC, ESCA, KIRC, LGG, LIHC, TGCT, and THCA. b Forest plot to describe OSM-related disease-specific survival of cancer patients and Kaplan–Meier curves for disease-specific survival analysis in ACC, CESC, ESCA, GBM, KIRC, LGG, TGCT, and THYM, and THCA. c Forest plot to describe OSM-related progression-free interval of cancer patients and Kaplan–Meier curves for progression-free interval analysis in CESC, GBM, KIRC, LGG, PRAD, and THYM. Hazard ratios and p values are shown

