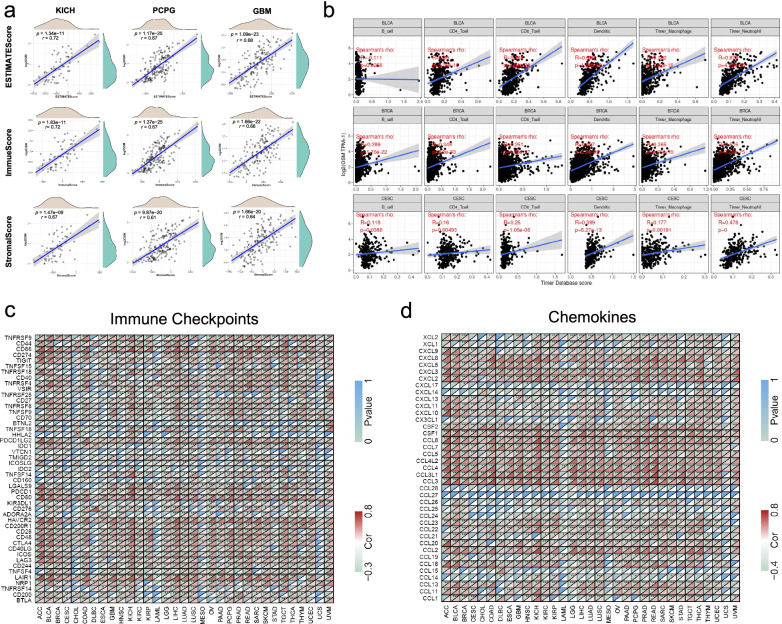
Fig. 3.
OSM-related cell infiltration and molecule expressions in tumor microenvironment. a OSM-related ESTIMATE score, immune score and stromal score in tumor microenvironments of the top3 cancer types (KICH, PCPG and GBM) via ESTIMATE algorithm. Spearman’s p values and partial correlation values are displayed. And density distribution of OSM levels, stromal scores, immune Scores, and ESTIMATE scores are also plotted. b Correlation analysis between OSM expression and the specific immune cell types in BLCA, BRCA, and CESC via TIMER algorithm. Dendritic cell, macrophage, neutrophil, B cell, CD4+ T cell, and CD8+ T cell are involved. Spearman’s p values and partial correlation values are displayed. c Correlation heatmap of OSM-related immune checkpoints across 33 cancer types in TCGA. d Correlation heatmap of OSM-related chemokines across 33 cancer types in TCGA. The colors in the bottom right corner of each grid represent Spearman’s correlation values. And the colors in the upper left corner of each grid represent Spearman’s p values. *p < 0.05, **p < 0.01, ***p < 0.001

