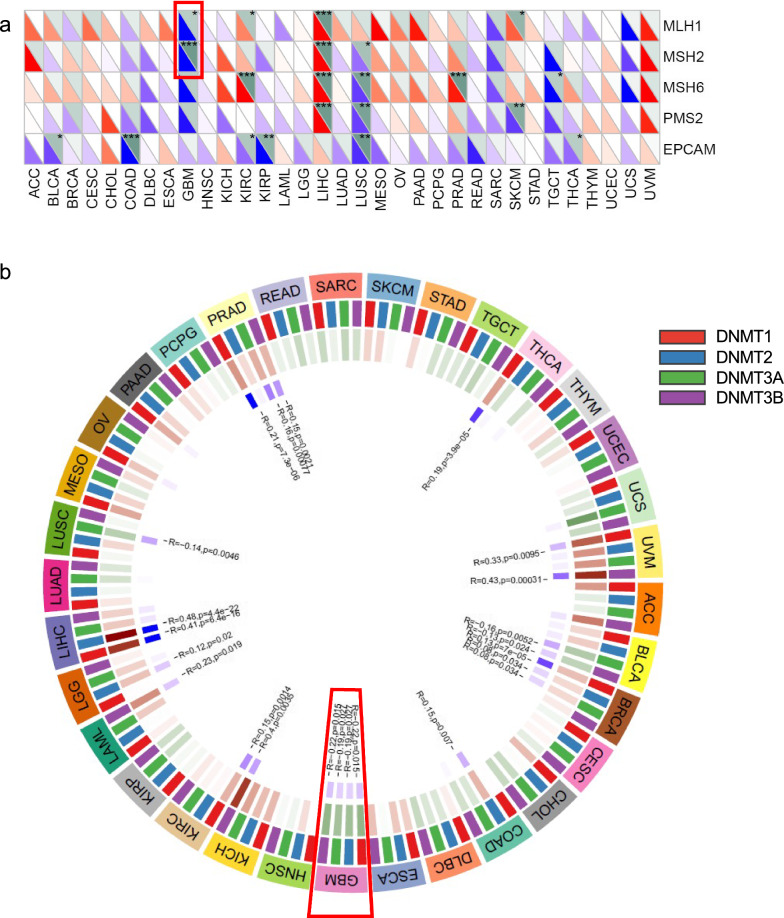
Fig. 4.
Correlation analysis between OSM expression and MMR gene, DNA methyltransferase gene expressions. a Heatmap of OSM-related five MMR gene co-expression (MLH1, MSH2, MSH6, PMS2, and EPCAM) of different cancers in TCGA. The colors in the bottom left corner of each grid represent Spearman’s correlation values. And the colors in the upper right corner of each grid represent Spearman’s p values. b Visualization of OSM-DNA methyltransferase gene co-expression. The colors of red, blue, green, and purple represent DNMT1, DNMT2, DNMT3A, and DNMT3B, respectively

