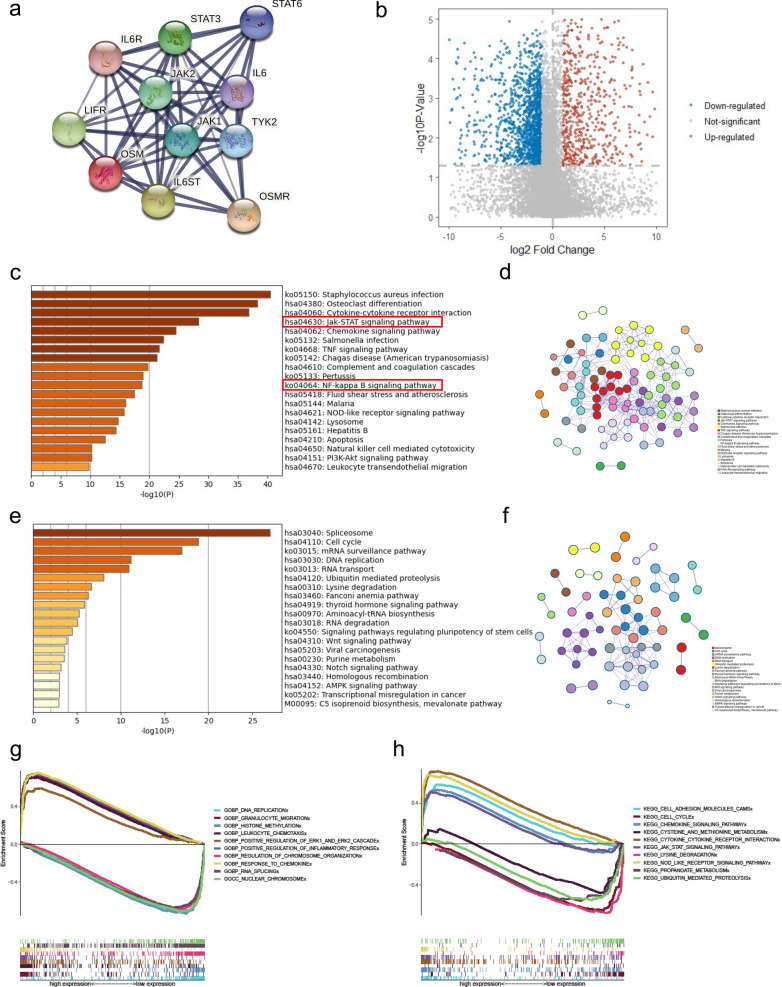
Fig. 5.
Main proteins and signaling pathways with regard to OSM-induced tumor progression. a PPI network of main OSM-binding proteins via STRING analysis. b Volcano plot shows the distribution of OSM-up-regulated and down-regulated genes. c Histogram of main OSM-up-regulated pathways in the OSM high expression group based on KEGG enrichment analysis. d Network plot to visualize the enriched pathways. The number of circles with identical colors represents the enrichment degree of each pathway. e Histogram of main OSM-down-regulated pathways in the OSM high expression group based on KEGG enrichment analysis. f Network plot to visualize the enriched pathways. g Enrichment plot of the main OSM-up-regulated and down-regulated pathways via GSEA analysis of GO gene sets. h Enrichment plot of the main OSM-up-regulated and down-regulated pathways via GSEA analysis of KEGG gene sets

