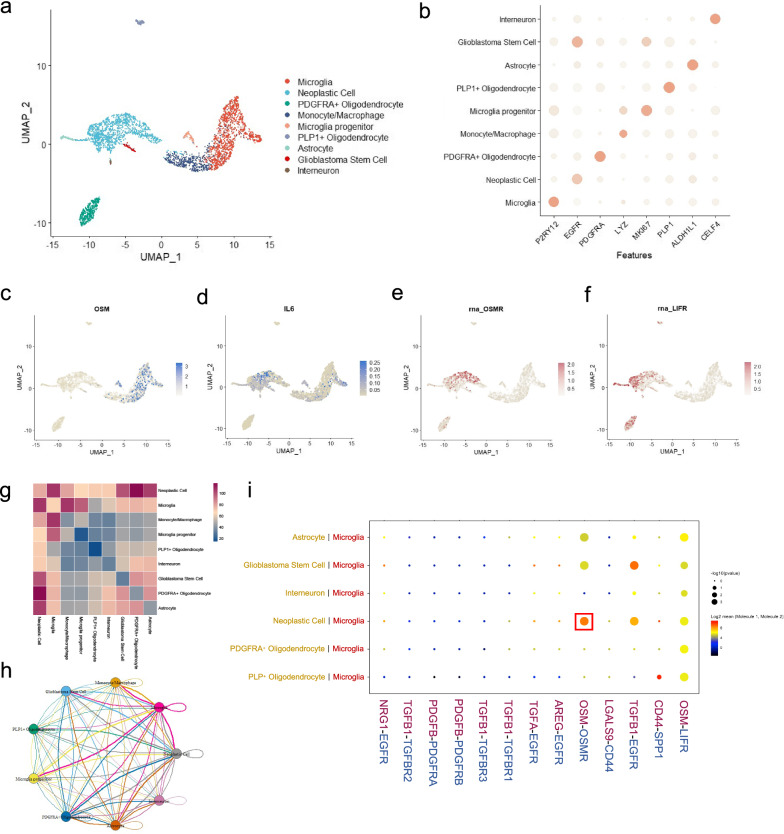
Fig. 6.
Expression of OSM-related molecules and cell–cell interactions in glioblastoma scRNA-seq data. a Identification of the various cell types in GBM tumor microenvironment. b Scatter diagram of the characteristic gene expression of different cell types. c–f Visualization of the distribution of ligand OSM/IL6 and receptor OSM/LIFR expression in various cell types in GBM tumor microenvironment. g Heatmap to describe the intercellular communication frequency of various cell types. The color of each grid represents the cell–cell interaction score. h Network plot of intercellular communications among selected cell types. i Visualization of the interaction pathways between microglia and other cell types. The size of the circle represents p value. The color of the circle demonstrates the mean value of cell–cell interaction

