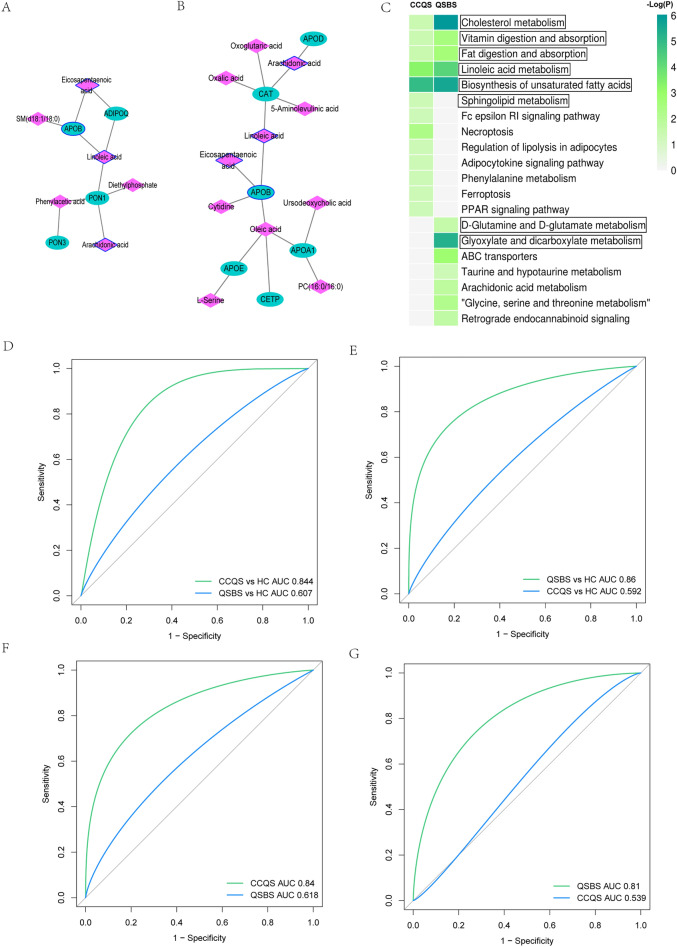
Fig.5.
Metabolome-proteome integrated analysis and ROC diagnosis. (A) Metabolome-proteome integrated analysis of CCQS patients. (B) Metabolome-proteome integrated analysis of QSBS patients. (C) KEGG metabolic pathways enriched with DMs and DPs of the two Syndromes. Pathways within the rectangles were also identified only by metabolomics or proteomics data. (D) The ROC diagnostic analysis of biomarker panel (ACTA2, FCGBP, LBP, IGHM) for different Syndromes. (E) The ROC diagnostic analysis of biomarker panel (CFHR3, EFEMP1, UBA52, APOD, CAT) for different Syndromes. (F) The ROC diagnostic analysis of biomarker panel (l-valine, pantetheine, lysoPC (20:2) and sphingosine 1-phosphate) for different Syndromes. (G) The ROC diagnostic analysis of biomarker panel (pyroglutamic acid, acetic acid, PC (20:1/14:1) and socitric acid)

