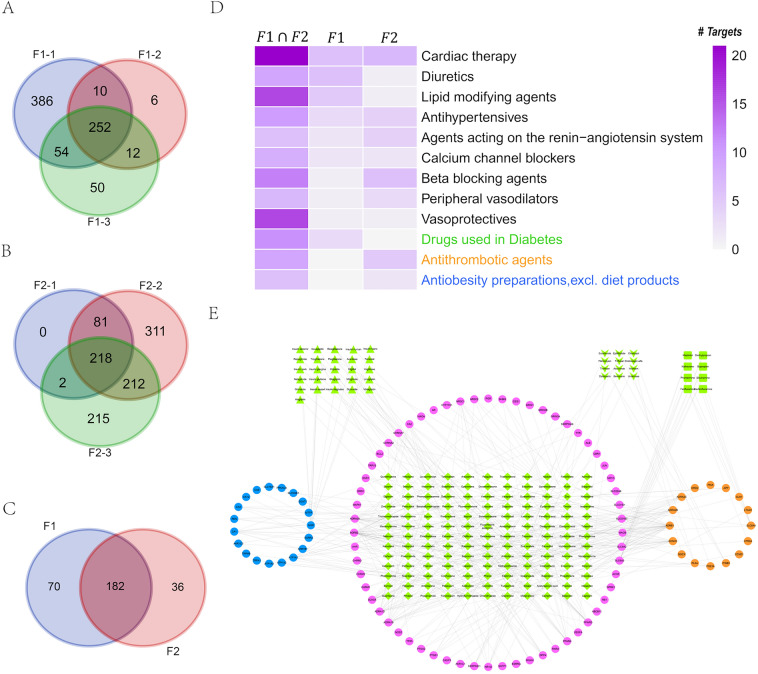
Fig. 6.
Analysis of the signature targets for the two classes of formulae. (A) Overlaps between the targets of the 3 formulae for CCQS. (B) Overlaps between the targets of the 3 formulae for QSBS. (C) Overlaps between the signature targets of the two classes of formulae. (D) Number of signature targets that overlapped with targets of FDA-approved CHD-related drugs, where black, green, orange, and blue text were drug categories for cardiovascular system (ATC ID:C), diabetes (ATC ID: A10), thrombotic events (ATC ID: B01), and obesity (ATC ID: A08), respectively. (E) Target-drug network between signature targets and FDA-approved CHD-related drugs. Pink cercles were common signatures for the two classes of formulae, while blue and orange circles were F1- and F2-specific signature targets, respectively. Diamond, triangle, V-type, and rectangle nodes were drugs for cardiovascular system, diabetes, ischemic stroke, and obesity, respectively

