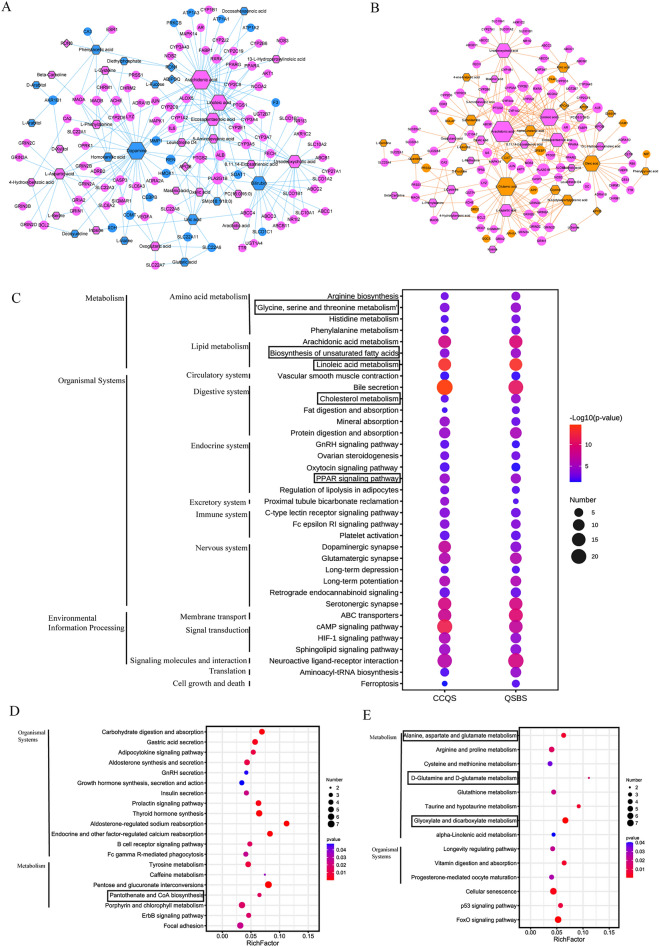
Fig. 7.
Integrated network analysis of multi-omics data. Integrated metabolite-gene network for CCQS (A) and QSBS Syndrome (B). Circles are feature targets of TCM formulae, diamonds are DPs, hexagons are metabolites. Pink nodes are molecules related to both Syndromes, blue and orange nodes are molecules related to CCQS and QSBS, respectively. (C) Common pathways enriched with molecules in integrated metabolite-gene networks of CCQS and QSBS. (D) Pathways only enriched with molecules in integrated metabolite-gene networks of CCQS. (E) Pathways only enriched with molecules in integrated metabolite-gene networks of QSBS. Pathways within the rectangles were also identified only by metabolomics or proteomics data

