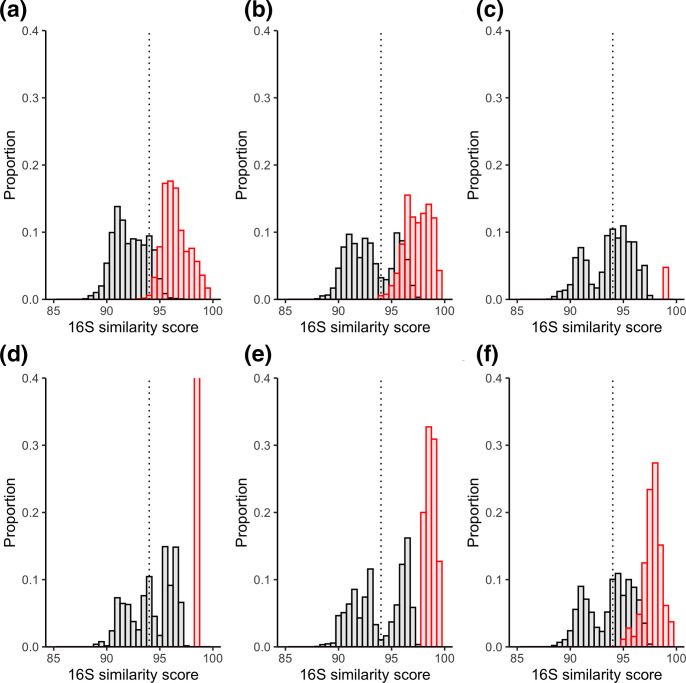
Fig. 1.
16S similarity scores between members of genera. Intra-genus scores are shown in red and inter-genus scores are shown in black. Histogram bin sizes are 0.5 %. The proposed genus boundary of 94.5 % is represented by the dashed line. Each genus is shown separately as follows: (a) Mycobacterium (original); (b) Mycobacterium (Gupta); (c) Mycobacteroides ; (d) Mycolicibacillus ; (e) Mycolicibacter ; (f) Mycolicibacterium . Note that the intra-genus proportion for Mycolicibacillus is 1.0 but the y-axis is cut at 0.4 for comparison between plots.

