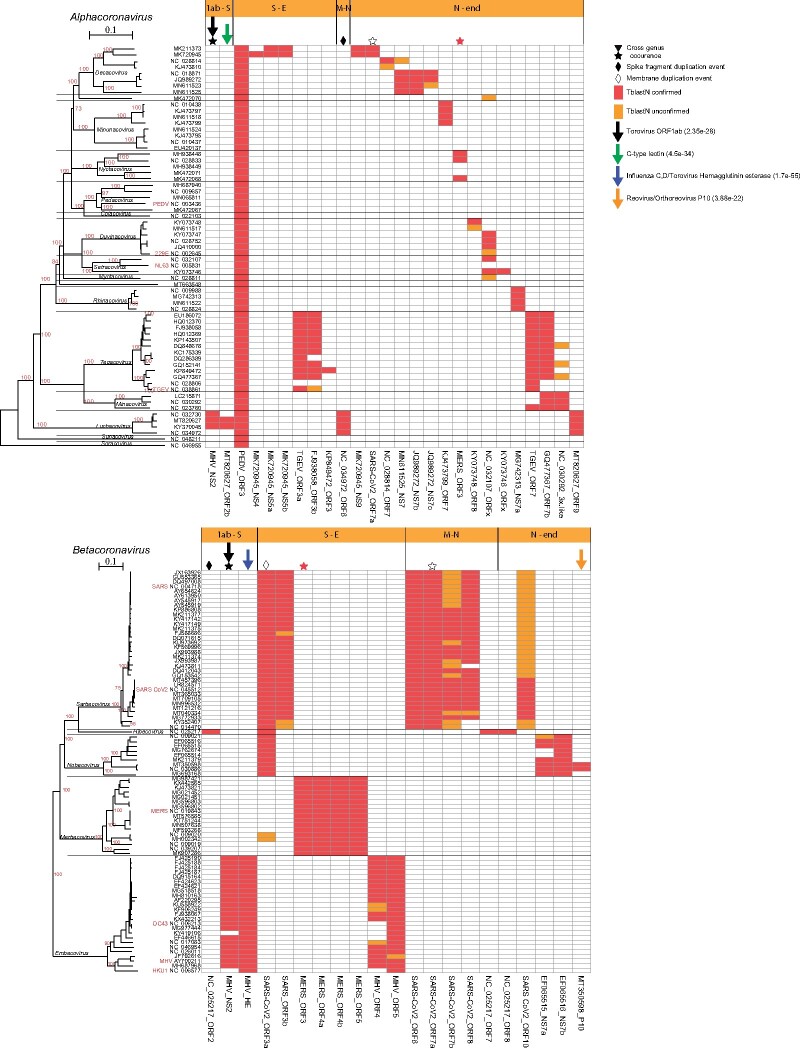
Fig. 3.
Presence and distribution of AOFs in the α- and β-CoVs. Each column in the matrix represents a certain AOF. Red color (within the matrix cells) denotes the (TblastN) presence of an AOF that is also verified by a predicted ORF with length ≥30 aa, whereas if the length of the predicted ORF is <30 aa, then it is denoted with orange color. Stars denote AOFs that are present in both α- and β-CoV members, whereas diamonds denote an AOF that resulted from duplication of a core ORF. Downward arrows denote AOFs that have homologs in non-CoV genomes, together with their best PSI-BLAST hit e-value. Horizontal orange bars (above the matrices) denote the genomic region where the AOF is located, that is, S-E denotes the region between the Spike and Envelope ORFs.

