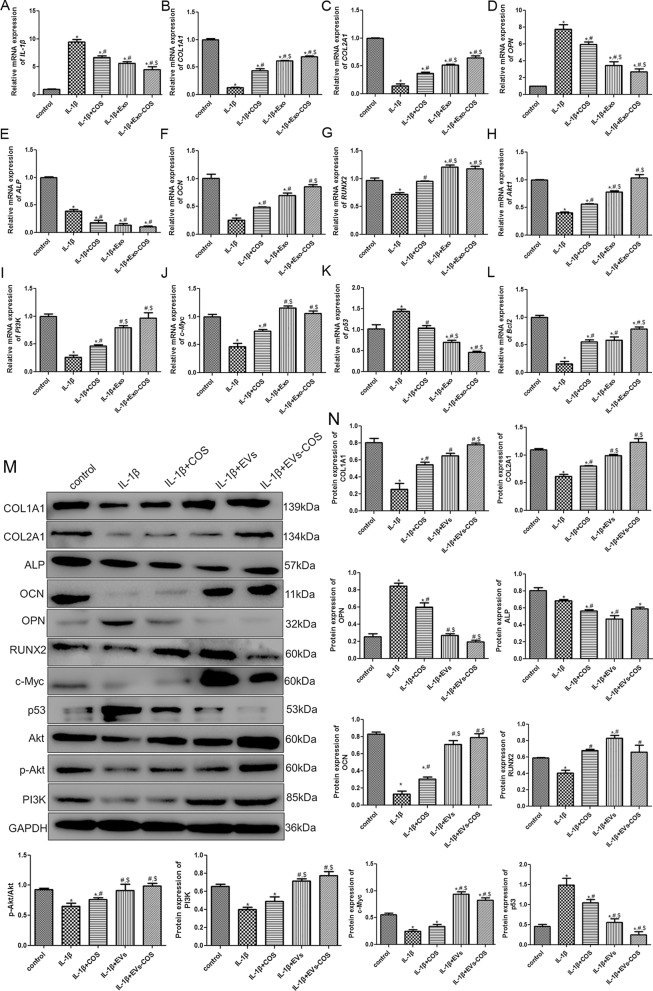
Fig. 4.
The effects of EVs-COS on the expression levels of related genes and proteins in the chondrocytes with different treatments. The mRNA expression of IL-1β (A), COL1A1 (B), COL2A1 (C), OPN (D), ALP (E), OCN (F), RUNX2 (G), Akt1 (H), PI3K (I), c-Myc (J), p53 (K), and Bcl2 (L). M The protein bands determined by Western blot. (N) The protein expressions of COL1A1, COL2A1, ALP, OCN, OPN, RUNX2, p-Akt/Akt, PI3K, c-Myc, and p53. *P < 0.05, compared with the control group; #P < 0.05, compared with the IL-1β group; $P < 0.05, compared with the IL-1β+COS group; &P < 0.05, compared with the IL-1β+EVs group

