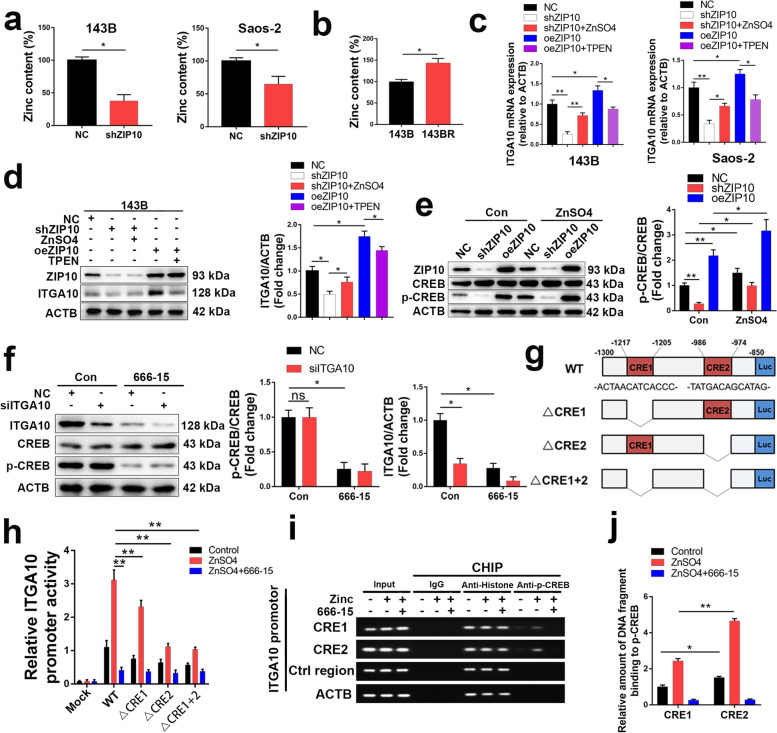
Fig. 4.
ZIP10 increases CREB phosphorylation, leading to upregulation of ITGA10 transcription. a, b Zn concentrations were analyzed in OS cells with/without ZIP10 knockdown using FluoZin-3 AM. c, d ITGA10 mRNA (c) and protein (d) levels were analyzed in OS cells treated with Zn supplementation (ZnSO4) or Zn chelator (TPEN). e WB analysis of CREB and p-CREB expression in 143B cells treated with/without ZnSO4. f WB analysis of p-CREB in 143B cells with/without ITGA10 knockdown. WB analysis of ITGA10 in 143B cells with/without CREB inhibition (666–15). g Schematic diagram showing the promoter structures of luciferase constructs: the wild-type ITGA10 promoter (WT), deletion mutants lacking CRE1 (△CRE1), CRE2 (△CRE2), or both (△CRE1 + 2). The CRE1 and CRE2 motif sequences are indicated. TSS, transcription start site. LUC, luciferase. h 143B cells were transfected with plasmids encoding ITGA10(− 1300/− 800)-Luc WT, △CRE1, △CRE2 or △CRE1 + 2. Then, OS cells were treated with Zn supplementation (ZnSO4) or CREB inhibitor (666–15). Luciferase levels were measured in extracts after 48 h. i ChIP of putative CREB response elements (CRE 1 and 2) within the ITGA10 promoter region determined by PCR. The promoter’s non-CRE region (Ctrl motif) and the β-actin region were used as negative controls; histone antibody or rabbit IgG were assay controls. j ChIp results confirmed by qRT-PCR. Data are means ± SEM; *P < 0.05, **P < 0.01

