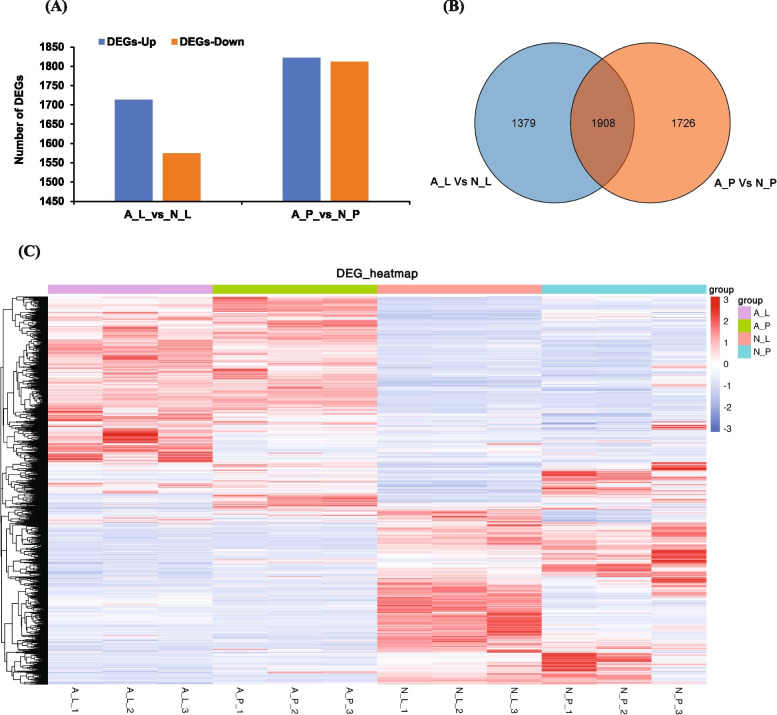
Fig. 4.
Analysis of differentially expressed genes (DEGs) between labellum and petals of normal and albino flower in Paphiopedilum hirsutissimum. A Number of up- and down-regulated genes between normal and albino tissues. B Venn diagram showing the shared and specific number of DEGs between labellum and petal tissues. C Heatmap showing expression pattern of DEGs in each sample based on FPKM values. N_L, normal labellum; N_P, normal petal; A_L, albino labellum; A_P, albino petal. The number 1, 2 and 3 with each sample represents number of replicates

