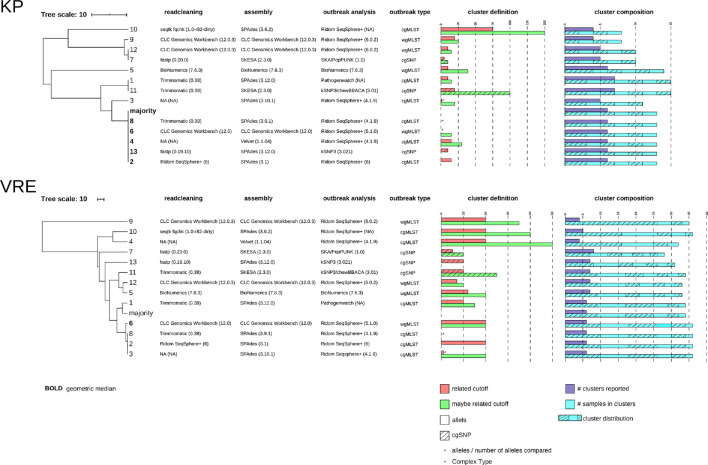
Fig. 1.
UPGMA tree-of-centres for both the KP as the VRE dataset. The trees indicate the relation of reported outbreak outcome of all 13 centres. Majority and geometric median calculations are added to the UPGMA trees. The data next to the UPGMA trees show the bioinformatic workflow used per centre divided in readcleaning, assembly, and outbreak analysis tools. Furthermore, cluster definitions applied per centre are plotted in barplots and the outcome of the centres is indicated in the barplots with cluster composition. Legends are integrated in the figure.

