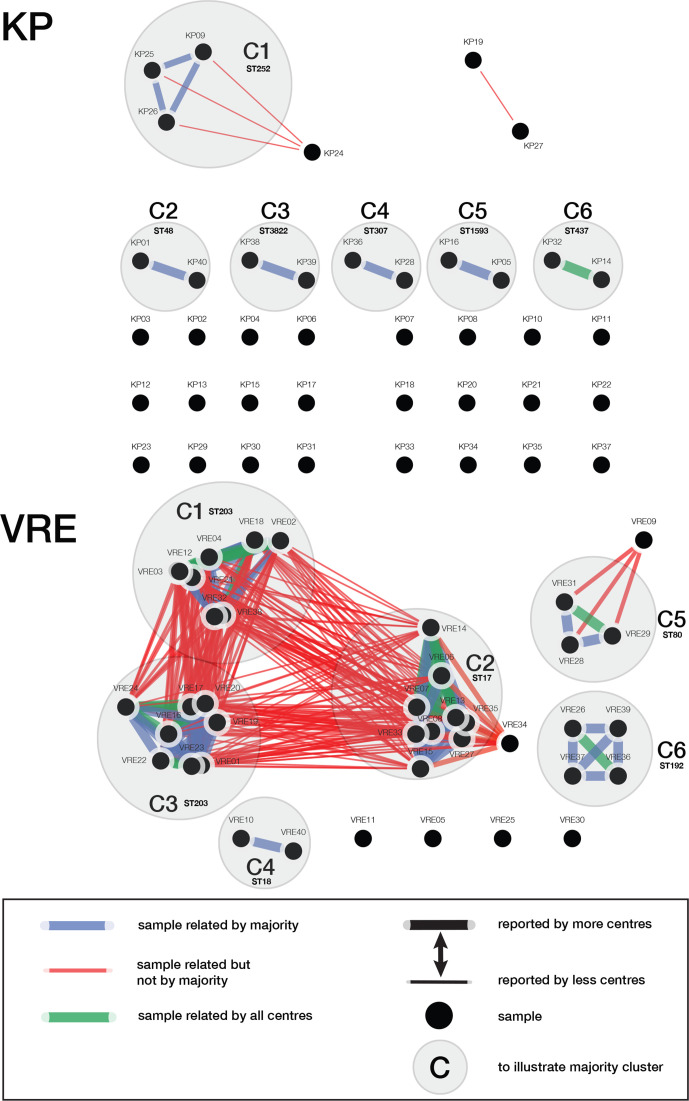
Fig. 2.
Sample-to-sample relations as reported by the 13 participating centres. The figure is divided in the K. pneumoniae (KP) outcome and in the VRE outcome. All samples are named according the naming that was provided throughout the study. Legend of the figure can be found in the right corner of the figure. The ST that was reported by the majority of the centres was added at each cluster.

