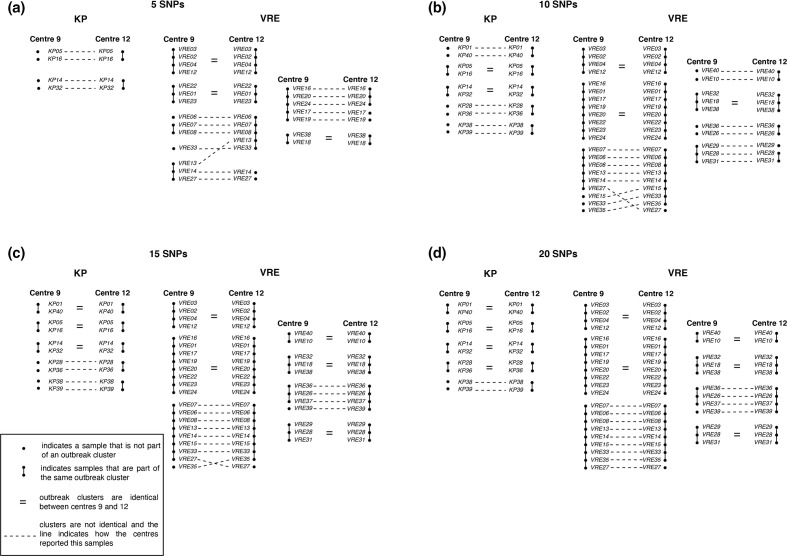
Fig. 4.
Illustration of differences in sample-to-sample relations between centre 9 and centre 12. This figure illustrates for a sweep cut-off of 5, 10, 15 and 20 SNPs using the cgSNP method the differences in outbreak cluster composition between centre 9 and centre 12. Both given for the KP as well as the VRE samples.

