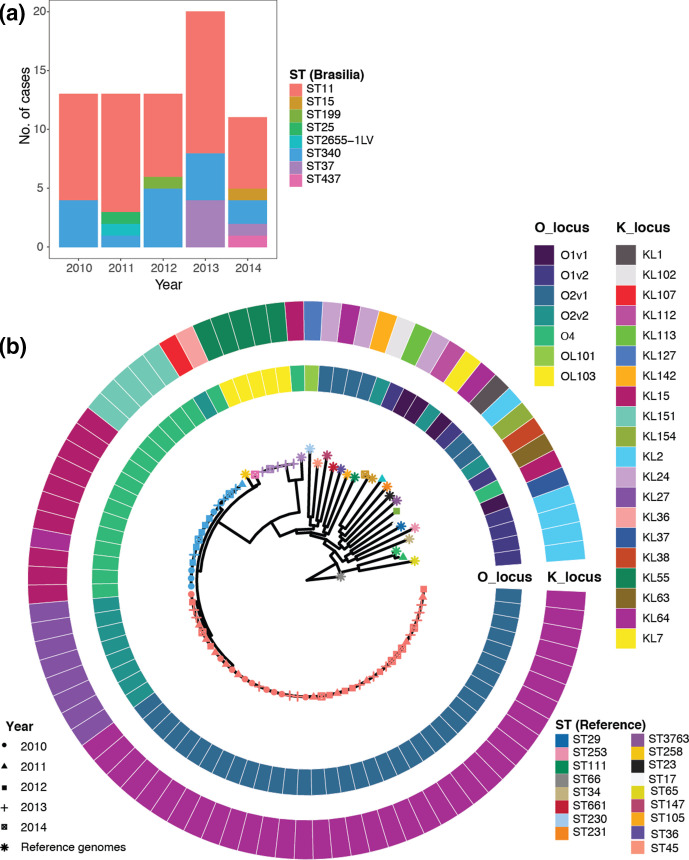
Fig. 2.
Distribution of ST, capsule biosynthesis (K) and LPS (O) loci. (a) Number of isolates of a particular ST sampled per year from Brasília’s hospitals, and (b) capsule and O-antigen serotype prediction mapped onto a circular core-genome SNP phylogeny, with tips labelled by sampling year (shape) and ST group (colour). Twenty reference-quality K. pneumoniae isolates (*) are included in the SNP phylogeny (b). For both (a) and (b), colour indicates ST groups, with Brasília isolates at the top and reference strains at the bottom.

