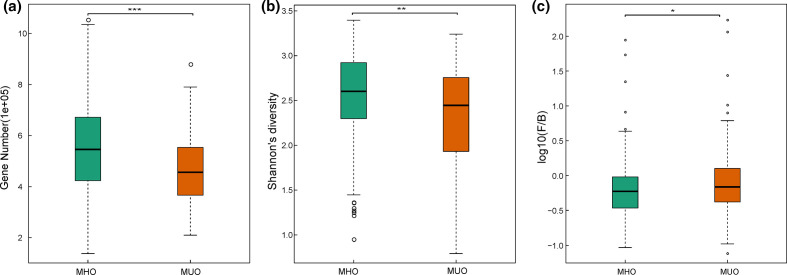
Fig. 2.
Comparison between the gut microbiome in MHO (n=172) and MUO individuals (n=138) from Chongqing. (a) Box plot of the gene count in MHO and MUO individuals; (b) Shannon diversity; and (c) F/B ratio. For (a–c), two-tailed Wilcoxon rank sum test was used to determine significance. Boxes represent the interquartile ranges (IQRs) between the first and third quartiles, and the line inside the box represents the median; whiskers represent the lowest or highest values within 1.5 times IQR from the first or third quartiles. *, **, *** represent the p-value < 0.05, < 0.01, < 0.001 respectively.

