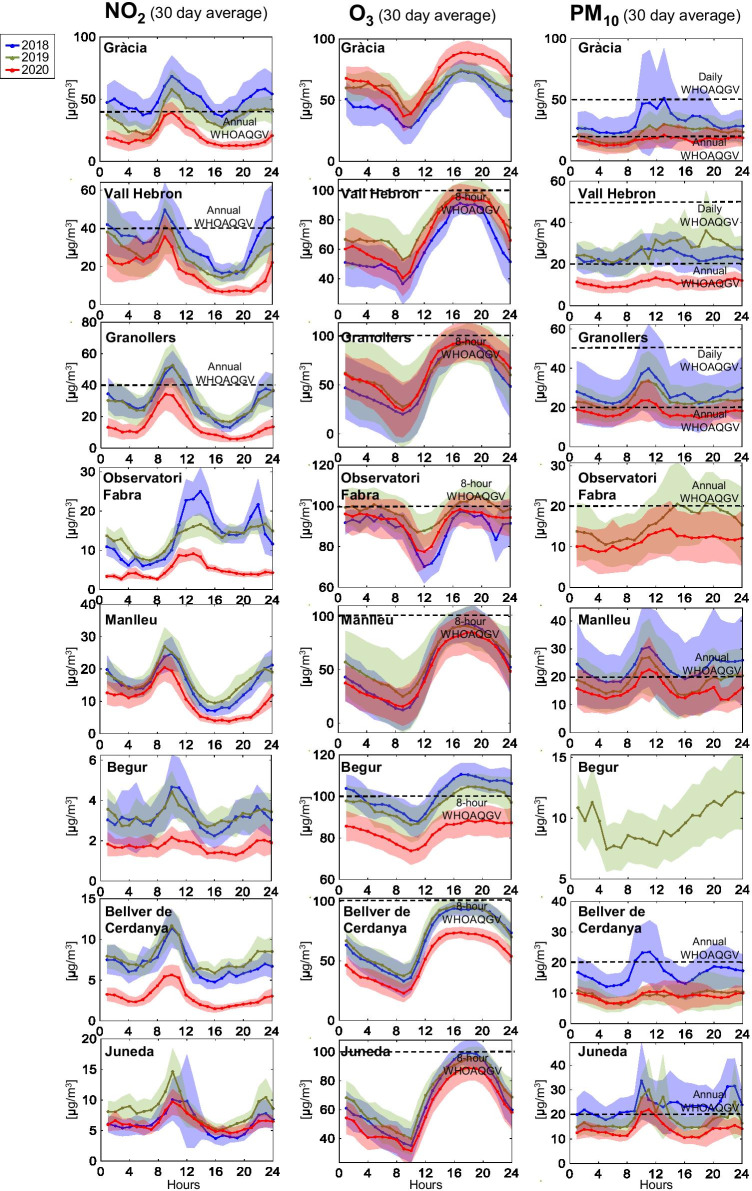
Fig. 6.
Hourly average (30 days) concentrations of NO2, O3, and PM10 together with their standard deviation (shaded areas) calculated during April 2018 (blue), 2019 (green), and 2020 (red) for the different air quality monitoring stations. Observe that concentration values in y-axes are different depending on contaminant and station

