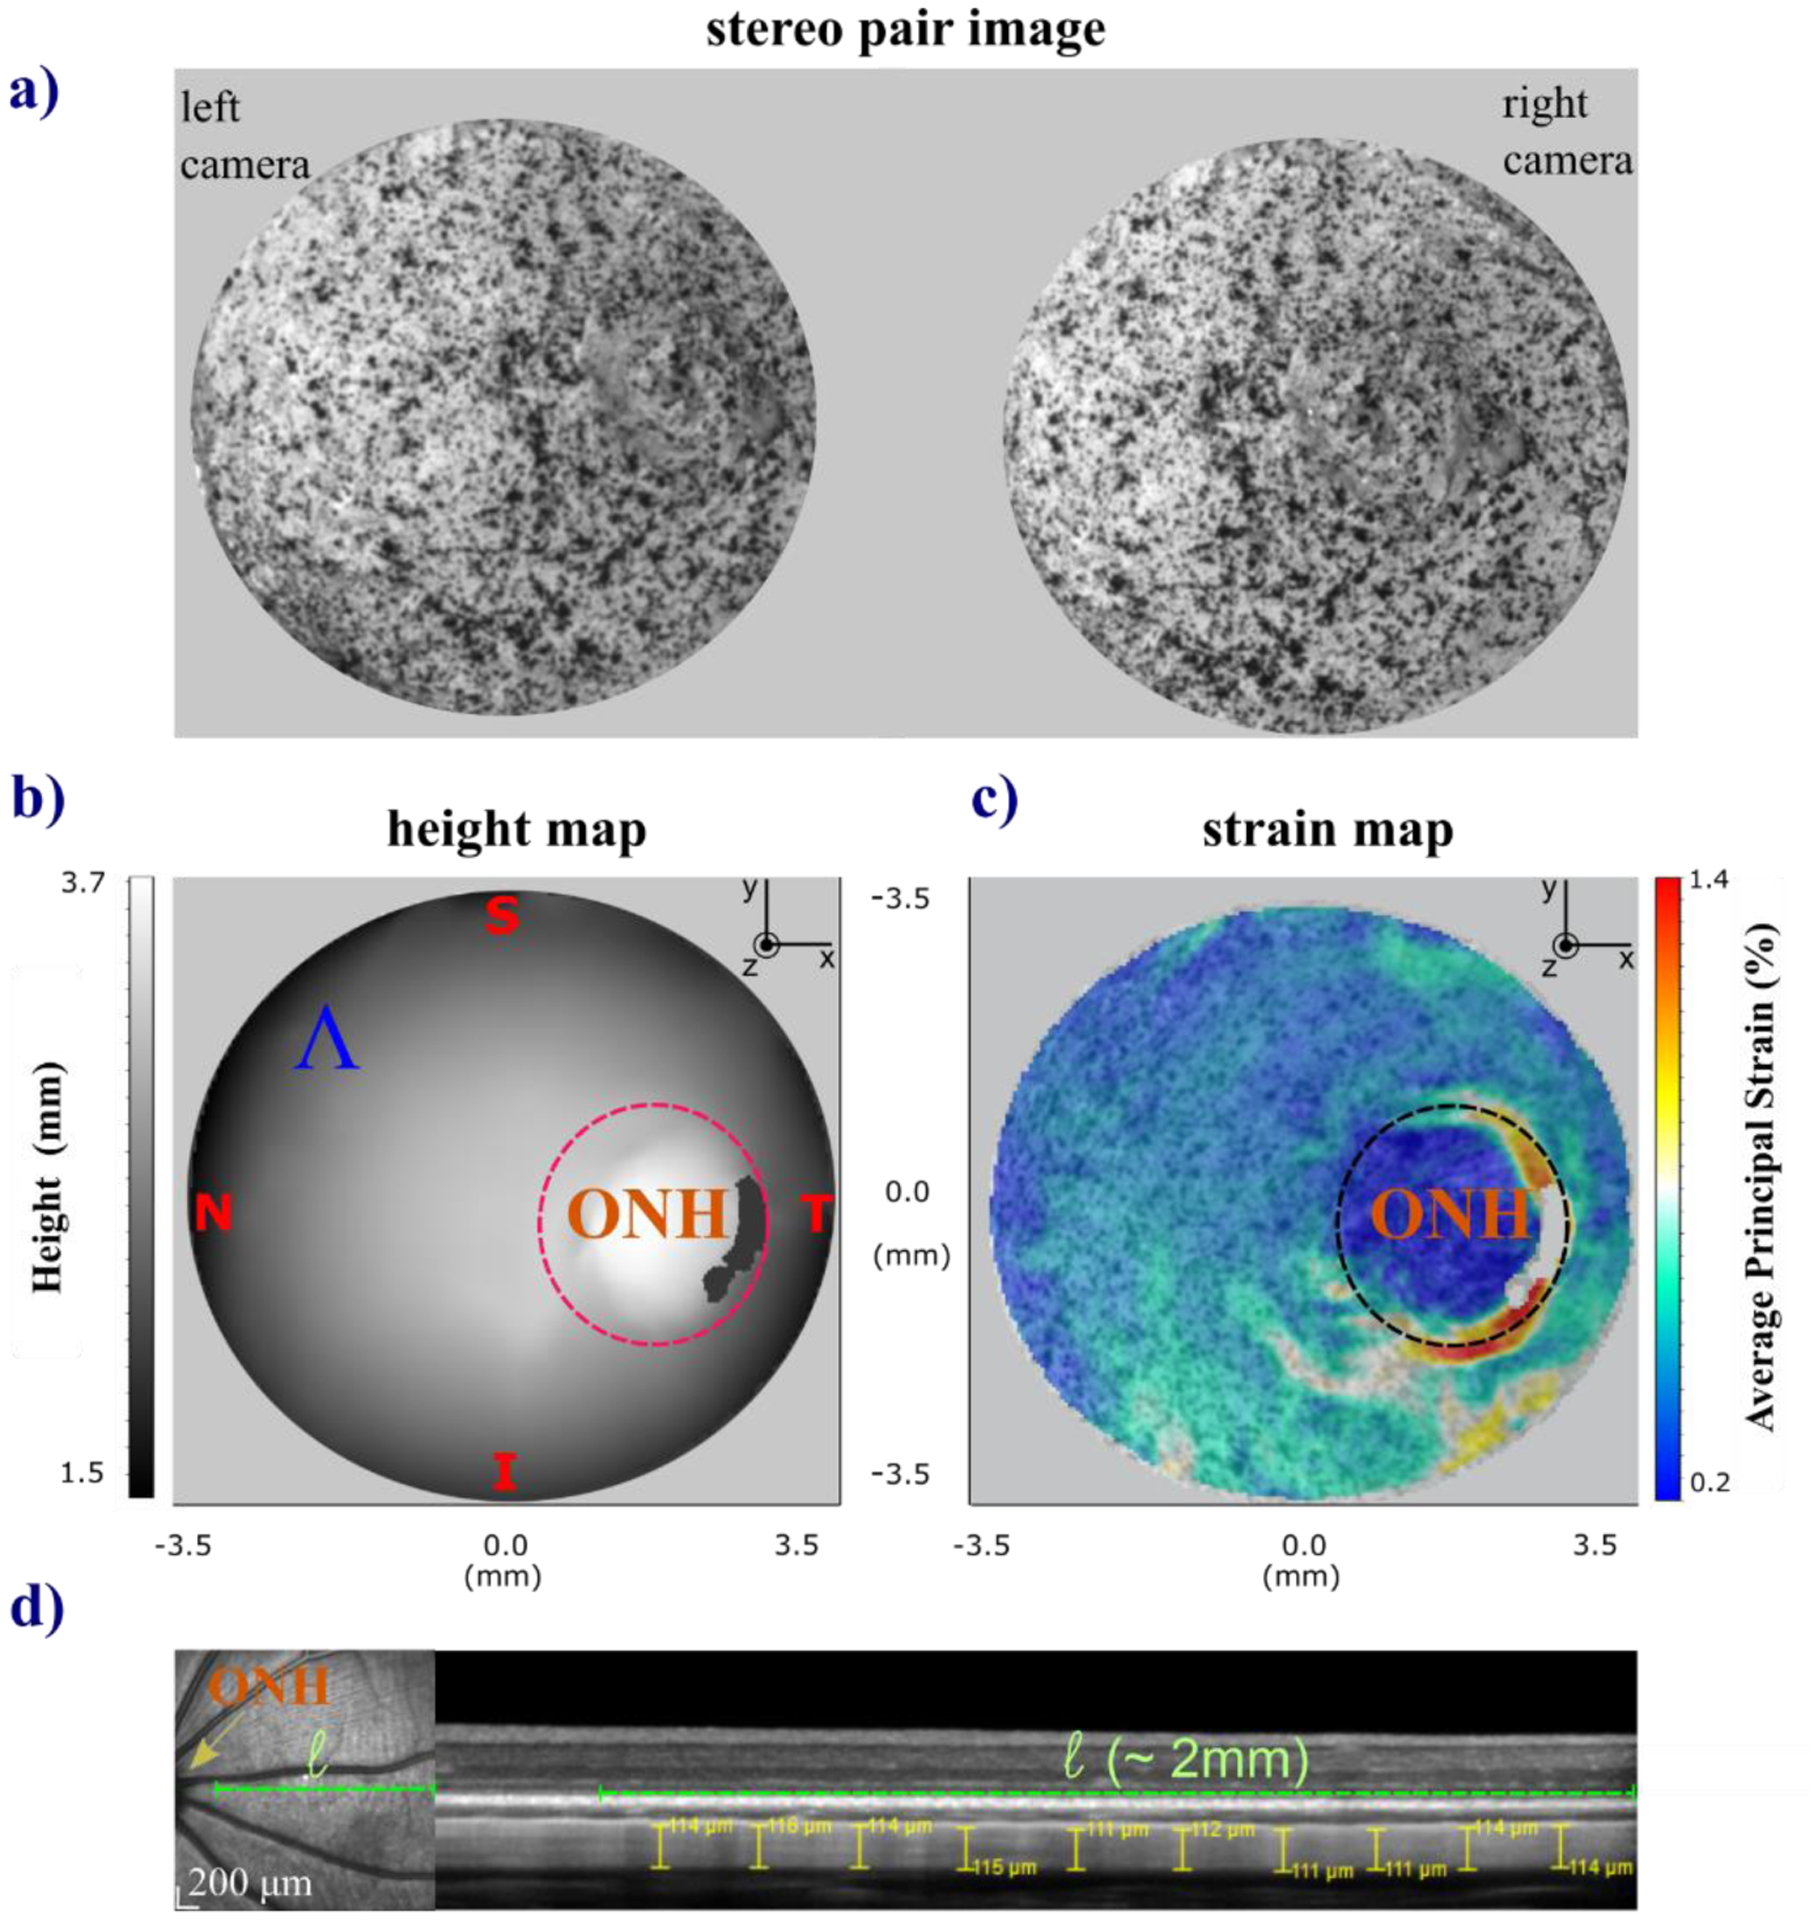
Fig. 3.

Schematic of the 3D-DIC images collected and calculated measures of the tree shrew scleral shells during inflation testing and OCT scan for scleral thickness measurement. One representative case, the scleral shell of a right eye is shown. The shell was placed on the pressurization chamber by orienting the ocular regions (T=temporal, N=nasal, S=superior, and I=inferior) along the coordinate axes. From a sequence of paired stereo images of the sclera surface with painted speckled texture (a) the LaVision-DaVis software calculates the height (b) and average principal strain maps (c). The ONH area was excluded from the best-fitting sphere to calculate the mean radius (R) of each shell and from the average strain (ε) calculation. (d) En-face scanning laser ophthalmoscopy image (on the left) showing the location of the OCT B-Scan (dashed green line). The ONH and posterior pole are near the left and right hand side of the image, respectively. 30 degree wide OCT scan using enhanced depth imaging (on the right). Ten thickness measurements near the posterior pole were obtained using the manual measurement tool of the Heidelberg Spectralis software.
