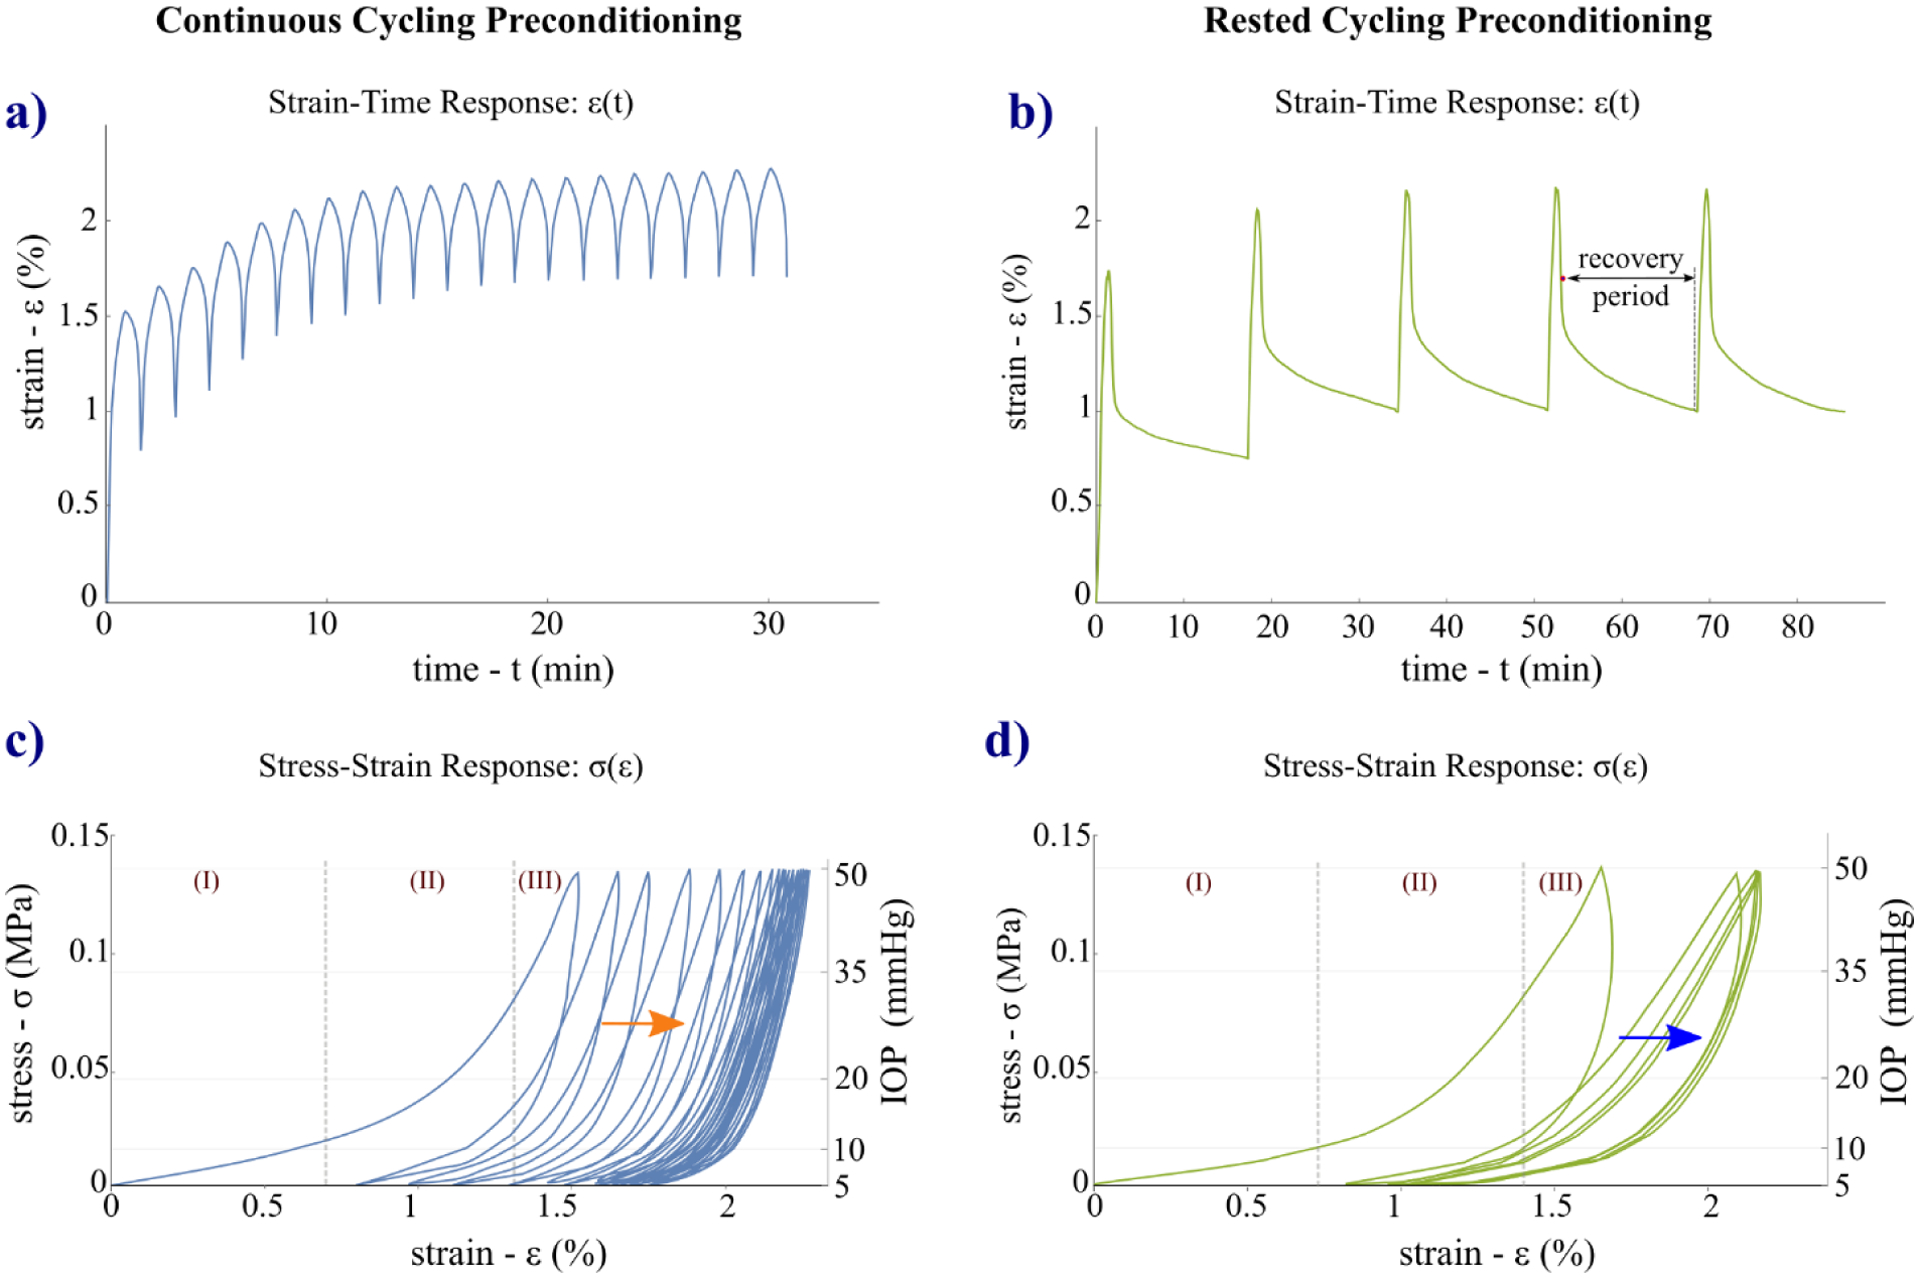
Fig. 5.

Strain-time ε(t) (a, b) and stress-strain σ(ε) (c, d) responses of one representative sclera specimen tested by the CCP (left column) and RCP (right column) protocols. On the RCP’s strain-time ε(t) curve is indicated (b) the recovery period of 15 min applied between cycles. The stress-strain σ(ε) curves show a gradual rightward shifting (softening) toward higher strains in both protocols (c, d, arrows). Looking at the loading stress-strain curves of the first cycle, tree shrew sclera showed the typical J-shaped nonlinear response of biological tissues, where 3 stages can be distinguished: an initial linear behavior at low strains (I) becomes nonlinear at the intermediate toe region (II) and finally linear again at high strains (III).
