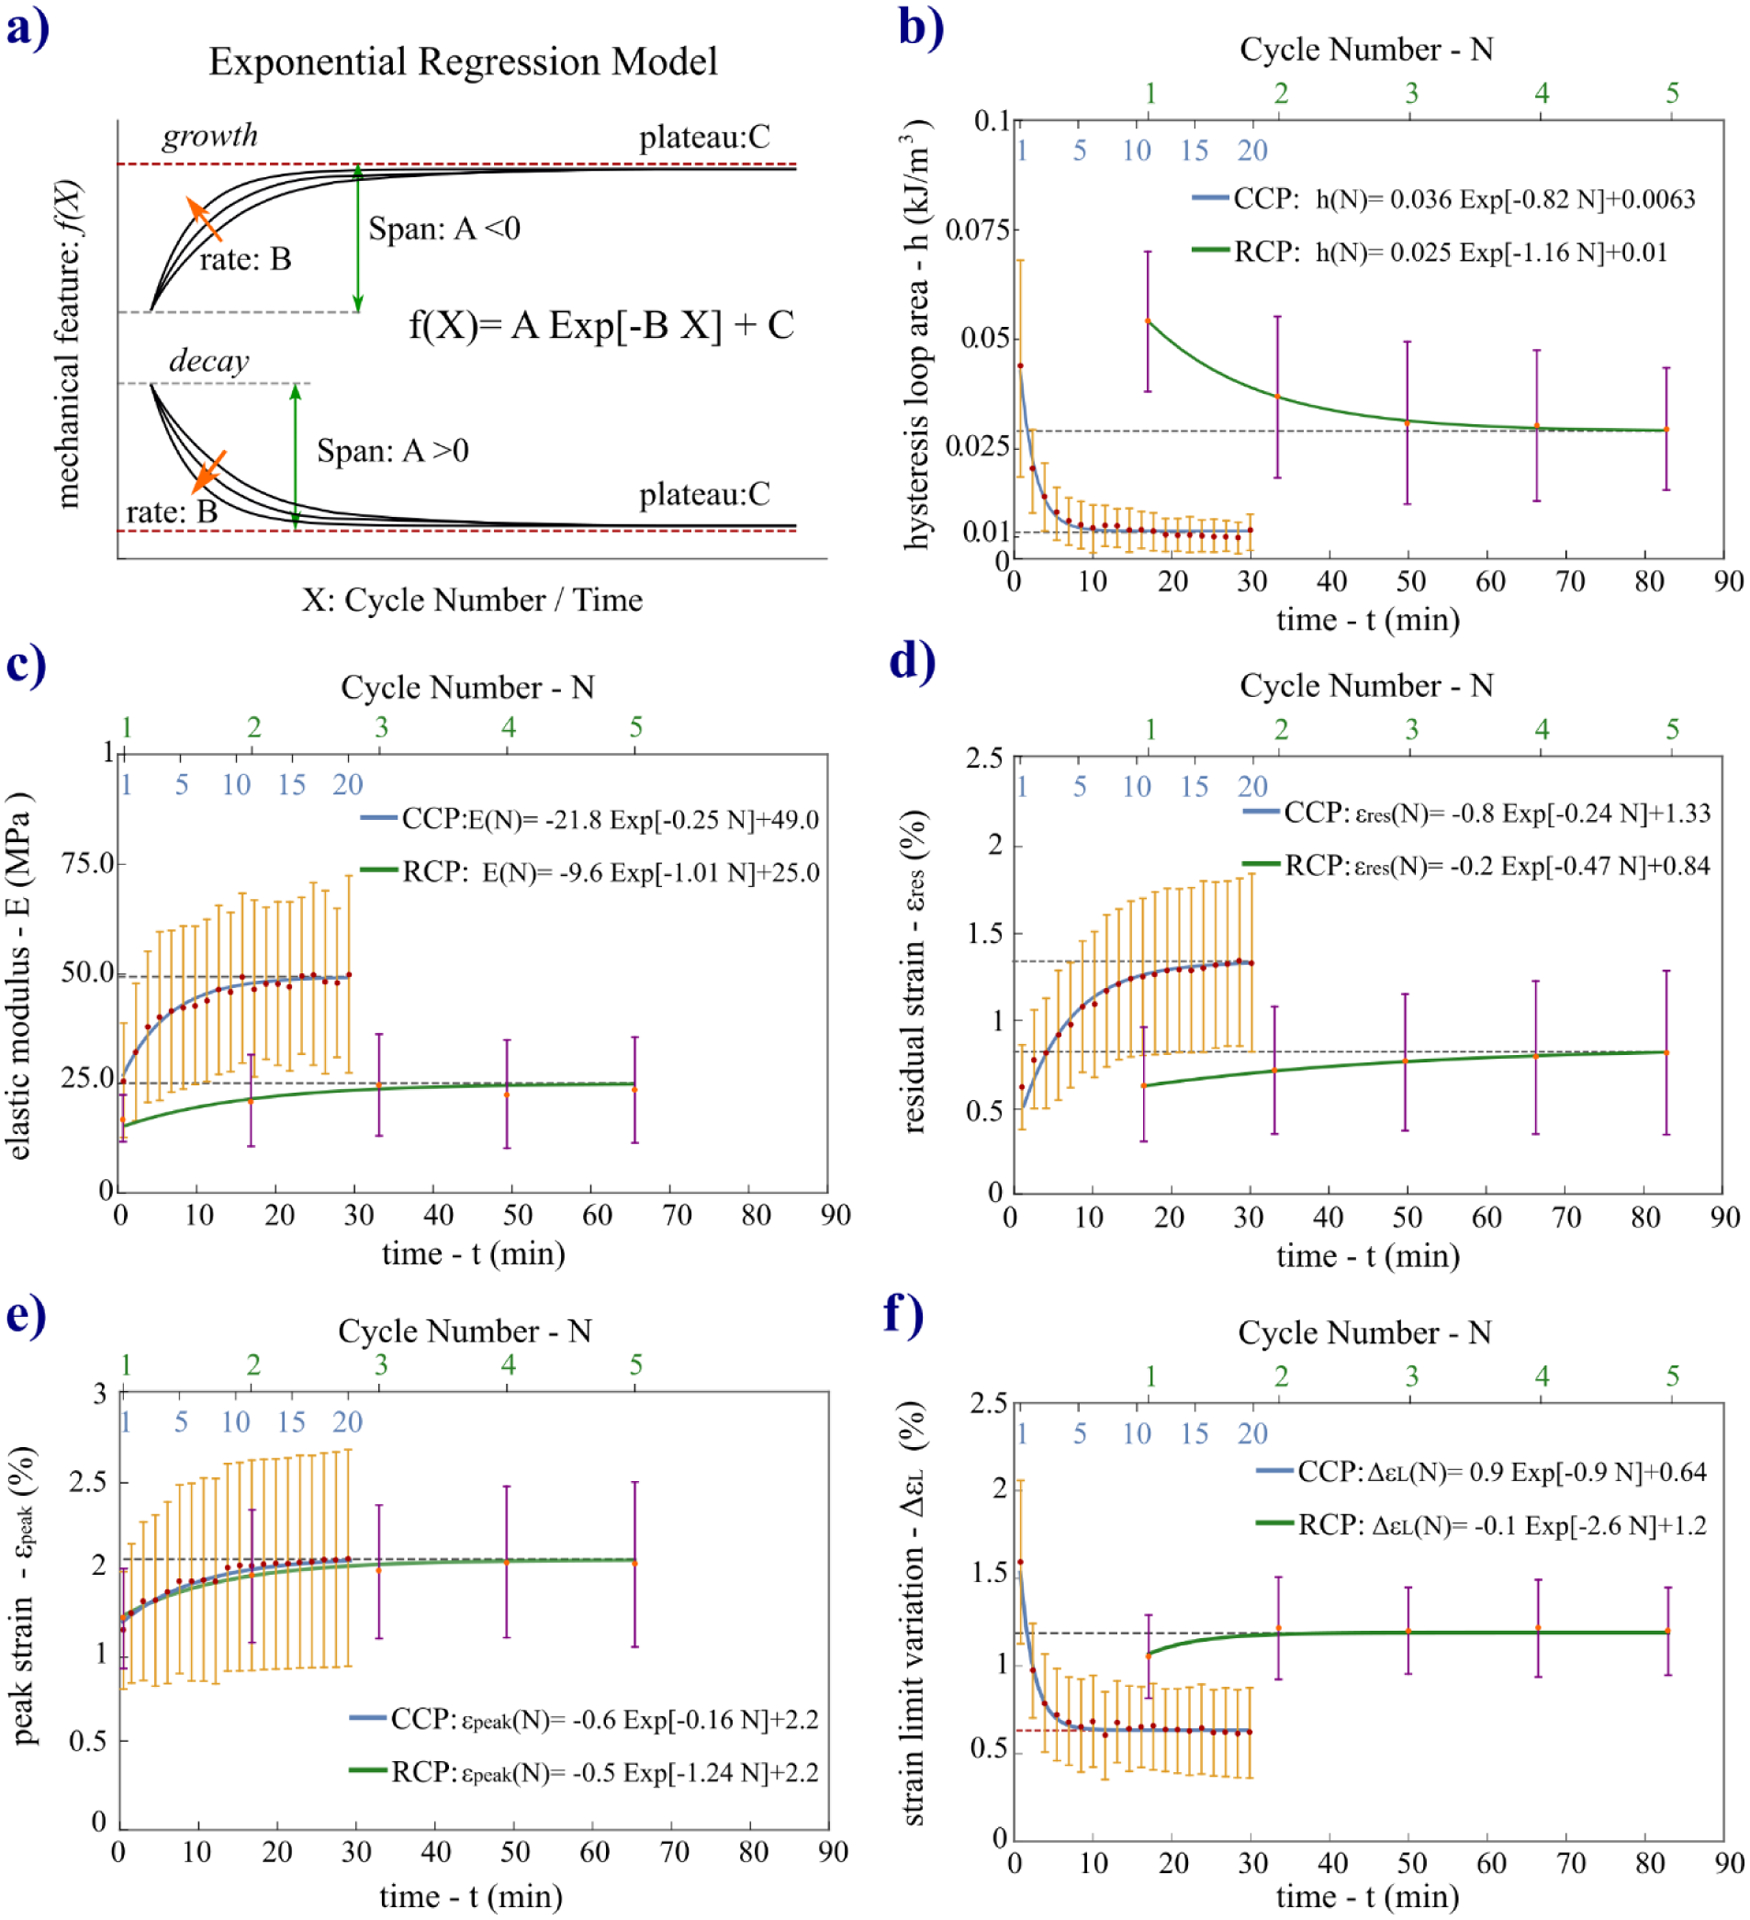
Fig. 6.

a) Illustration of the coefficients (A, B, C) of the exponential regression function used to fit the data of the mechanical variables characterizing the evolving preconditioning response over cycles. Orange arrows indicate direction of magnitude increase for B. b-f) Experimental data of the five variables plotted along with the mean curves (h(N), E(N), εres(N), εpeak(N), ΔεL(N)) obtained with the mean coefficients. The mean curves are plotted over time t and over cycle number N for both protocols to provide an easier graphical comparison.
