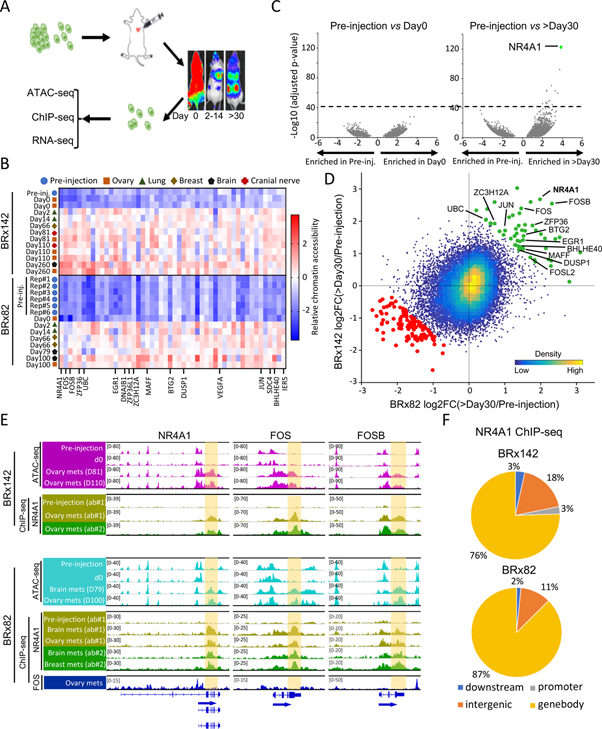
Figure 1. Increased chromatin accessibility across IEG genebodies and 3’-UTRs during tumor initiation.
(A) Schematic showing intracardiac injection GFP-luciferase tagged CTCs, serial imaging of metastases, recovery of tagged single cells from mouse tissues and genomic characterization. (B) Heatmap of top 50 regions with concordant gain of chromatin accessibility during tumorigenesis in both CTC lines across all samples analyzed by ATAC-seq. Color key indicates chromatin accessibility (low, blue; high, red). (C) Volcano plots shows absent chromatin accessibility changes in BRx142s in vitro (pre-injection) vs those retrieved from mouse ovary at day 0; dramatic differences in pre-injection CTCs versus CTC from ovary metastasis at day260 (>day30). Dotted line indicates threshold (−log10(adjusted p-value)>40) used in analysis. (D) Scatter plot shows regions gaining or losing chromatin accessibility across BRx142 and BRx82s (>day30 versus pre-injection). Each dot represents a 2-kb tile in the genome. Green dots represent regions gaining chromatin accessibility during metastasis in both CTC lines, and red dots represent regions losing chromatin accessibility. IEGs gaining chromatin accessibility are identified. (E) IGV tracks show ATAC-seq (purple or cyan), NR4A1 ChIP-seq (yellow and green) and FOS ChIP-seq (blue) signal at three IEGs: NR4A1, FOS, FOSB (upper: BRx142; bottom: BRx82). Genebody and 3’-UTR regions are highlighted. For NR4A1 ChIP-seq, light and dark green tracks represent ChIP-seq signal generated using two different antibodies (see Methods). (F) Pie charts show distribution of NR4A1 ChIP-seq peaks among different genomic regions in CTC-derived metastases, with predominance at genebody regions.

