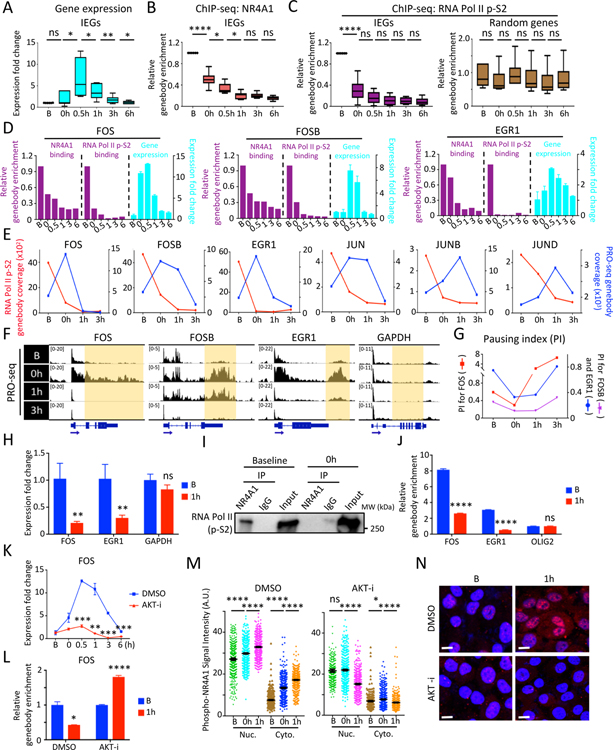
Figure 2. In vitro modeling serum stress-induced chromatin changes at IEG genebodies.
(A) Boxplots show time course of IEG expression (FOS, FOSB, JUN, JUNB, JUND, EGR1) at serum-replete baseline (B), after 24 hour serum starvation (0h) and at serial intervals following serum replenishment (0.5–6h) in MCF10A. (B-C) Reduction in NR4A1 binding (B) and RNA Pol II p-S2 (C) at the 6 IEG genebodies from baseline to serum withdrawal and replenishment generated from ChIP-seq data. 6 randomly picked genebodies across the genome serve as control for RNA Pol II p-S2 binding. (D) Bar graphs of representative IEGs (FOS, FOSB and EGR1) show inverse correlation between ChIP-seq binding at genebodies by NR4A1 or RNA Pol II p-S2 (purple) and corresponding IEG mRNA expression (cyan). Error bar represents SD. (E) Timeline of PRO-seq signal at IEG genebodies (blue) and RNA Pol II p-S2 occupancy at the same region (red) for 6 IEGs (FOS, FOSB, EGR1, JUN, JUNB, JUND) from timepoints B, 0h and serial intervals after serum (1h and 3h) in MCF10A. Left y-axis: RNA Pol II p-S2 read coverage, right y-axis: PRO-seq genebody coverage of the corresponding IEG. (F) IGV tracks show nuclear run-on sequencing (PRO-seq) signal at IEG genebodies at timepoints B, 0h, and serum treatment (1h, 3h). GAPDH: non IEG control. (G) Transient decrease in calculated RNA Pol II Pausing Index (PI) at representative IEGs (FOS, FOSB and EGR1), during serum withdrawal and serum treatment. (H) Detection of chromatin-bound IEG pre-mRNAs (FOS, EGR1) in MCF10A under serum-replete conditions (B), with marked reduction following serum refeeding (1h). GAPDH: non-IEG control. Error bar, SD. (I) Co-immunoprecipitation followed by western blot shows protein association between NR4A1 and RNA Pol II p-S2 in MCF10A at baseline, but not uponserum withdrawal (0h). (J) Sequential ChIP-qPCR (initial RNA Pol II followed by NR4A1 immunoprecipitation), shows colocalization of RNA Pol II and NR4A1 at the same IEG (FOS, EGR1) genebodies at baseline (B) with reduction following serum starvation and replenishment (1h). OLIG2: non-IEG control. Error bar, SD. (K) Suppression of FOS mRNA induction by serum starvation/refeeding following treatment of MCF10A with AKT inhibitor (AKT-i), Ipatasertib. (L) ChIP-qPCR shows persistence of NR4A1 binding at FOS genebody in MCF10A treated with AKT-i, despite serum starvation/replenishment (1h), compared with stress-induced reduction in NR4A1 binding in controls. Error bar, SD. (M) Quantitative analysis of single cell staining (Nuc: nuclear, Cyto: cytoplasmic) of phospho-NR4A1 (serine 351) in MCF10A treated with AKT-i or DMSO at serial intervals following serum starvation/refeeding (B, 0h, 1h). Error bar, SEM. (N) Representative images show suppression of serum stress-inducible nuclear and cytoplasmic phospho-NR4A1 (ser351) by AKT-i treatment, compared with DMSO. Baseline (B) compared with serum starvation/refeeding (1h). DAPI indicates nuclei; scalebar, 10 μM. In panels A-C, H, J-M, *P<0.05, **P<0.01, ***P<0.001, ****P<0.0001, ns, not significant, by two-tailed Student’s t-Test.

